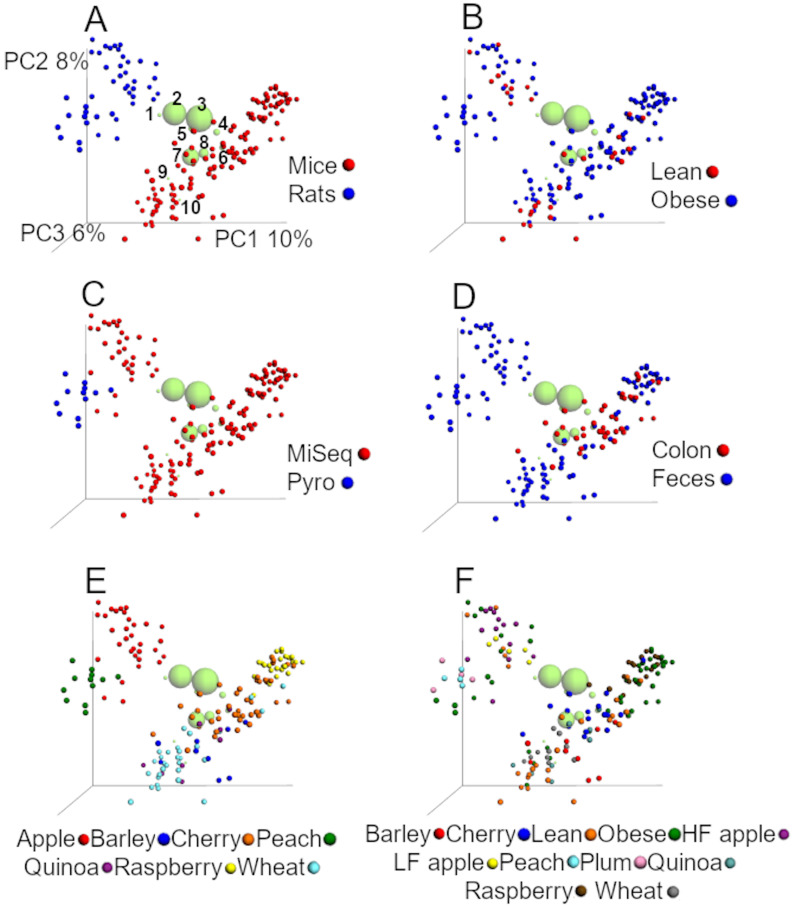
Figure 2. PCoA plots of unweighted UniFrac distances using data from the closed approach using the reference OTUs sequence file at 97% similarity (closed97 approach).
Each point represents a sample from one of the studies detailed in Table 1, and the plots highlight the effect of (A) animal model, (B) obesity status, (C) sequencing technique, (D) anatomical site, (E) study and (F) treatment. The labels “lean” and “obese” refer to lean and obese controls. The ten most abundant bacterial groups are superimposed in all plots (the bigger the circle, the bigger the relative abundance of each taxa) and labelled with numbers on the first plot (1: Ruminococcaceae, 2: Bacteroides, 3: Clostridiales, 4: Lachnospiraceae, 5: Oscillospira, 6: Enterobacteriaceae, 7: S24-7, 8: Lactobacillus, 9: Akkermansia, 10: Allobaculum) to show that clustering of samples is driven by specific bacterial groups that have previously been shown to influence (or be influenced by) health status, such as Akkermansia. The values for each axis are only shown in A to facilitate viewing. These plots were built using a rarefaction depth of 100 sequences per sample to account for as many samples as possible (only two samples were left out using this rarefaction depth). The UniFrac data was obtained from the closed97 approach but other approaches may reveal other patterns (see Tables 4 and 5).

