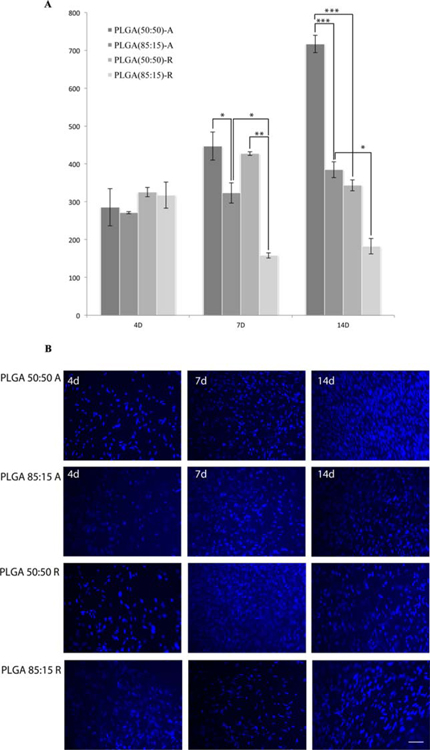
FIGURE 3.
A: Cell adhesion assay measured at days 4, 7, and 14. Bars represented as mean ± standard error of mean. Figure legend indicates scaffold composition as well as fiber orientation: A—Aligned and R—Random. Asterisks represent statistical significance: *p < 0.05, ** p < 0.005, and *** p < 0.0005. B: HFF seeded on scaffolds for 4, 7, and 14 days and nuclei stained using DAPI (blue), scale bar 20 µm. [Color figure can be viewed in the online issue, which is available at wileyonlinelibrary.com.]

