
Figure 5.
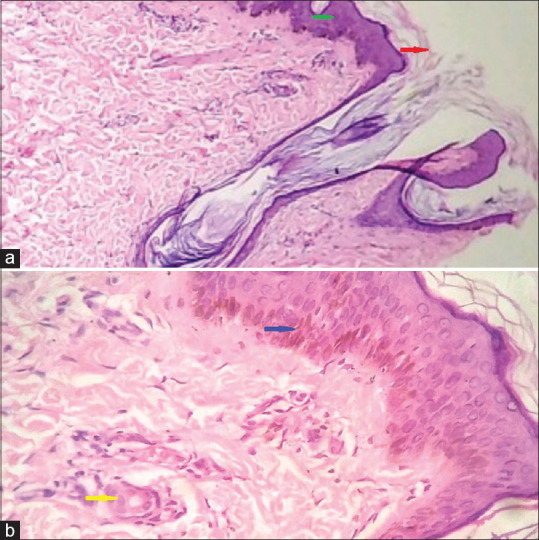
(a) Scanner view, showing follicular hyperkeratosis (Red arrow), acanthosis (Green arrow) (H and E, 10X). (b) Dermis showing increased pigmentation of basal cell layer (Blue arrow), mild perivascular lymphocytic infiltrate (yellow arrow) (H and E 40X)