Figure 4.
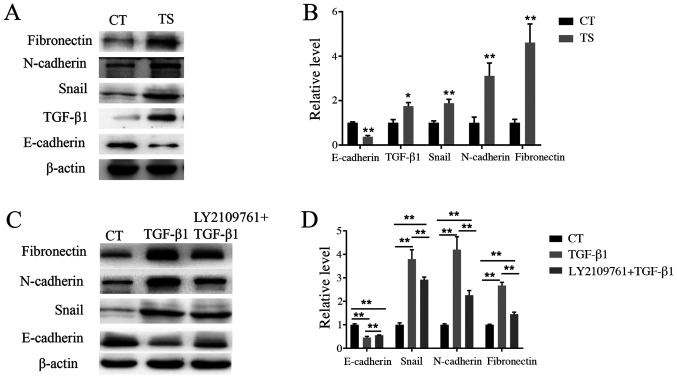
Detection of protein expression by western blotting. (A) Western blotting results for E-cadherin, TGF-β1, snail, N-cadherin and fibronectin in the TS and CT groups. (B) Semi-quantitative analysis of the expression levels of E-cadherin, TGF-β1, snail, N-cadherin and fibronectin in the TS and CT groups. *P<0.05 and **P<0.01 vs. CT. (C) Western blotting results for EMT-associated proteins after treatment with TGF-β1 or co-treatment with TGF-β1 and LY2109761. (D) Semi-quantitative analysis of the expression levels of EMT-associated proteins after TGF-β1 stimulation or co-treatment with TGF-β1 and LY2109761. **P<0.01 as indicated. CT, control; TS, tympanosclerosis.

