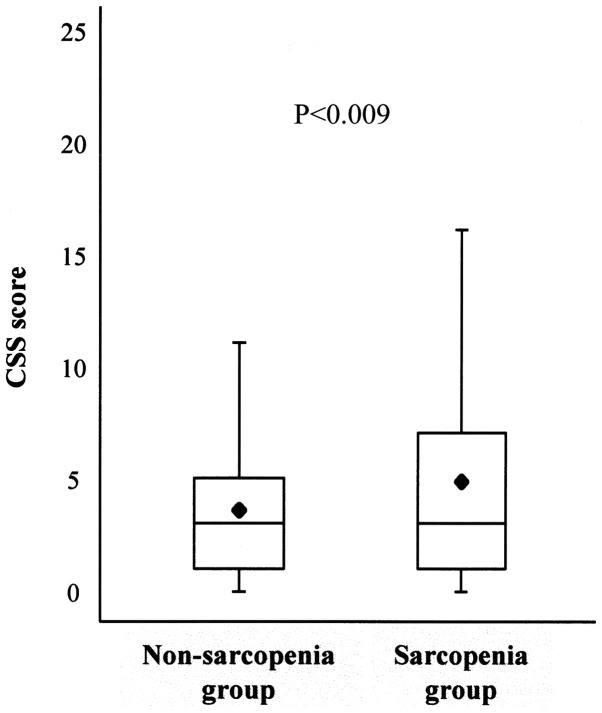
Figure 2.
Association between the CSS score and sarcopenia. Box and whisker plots of the Constipation Scoring System (CSS) score in the non-sarcopenia and sarcopenia groups show the minimum and maximum values. The lower hinge, median, and upper hinge of the box correspond to the 25, 50, and 75th percentiles, respectively. The mean in each group is indicated by the rhombus.

