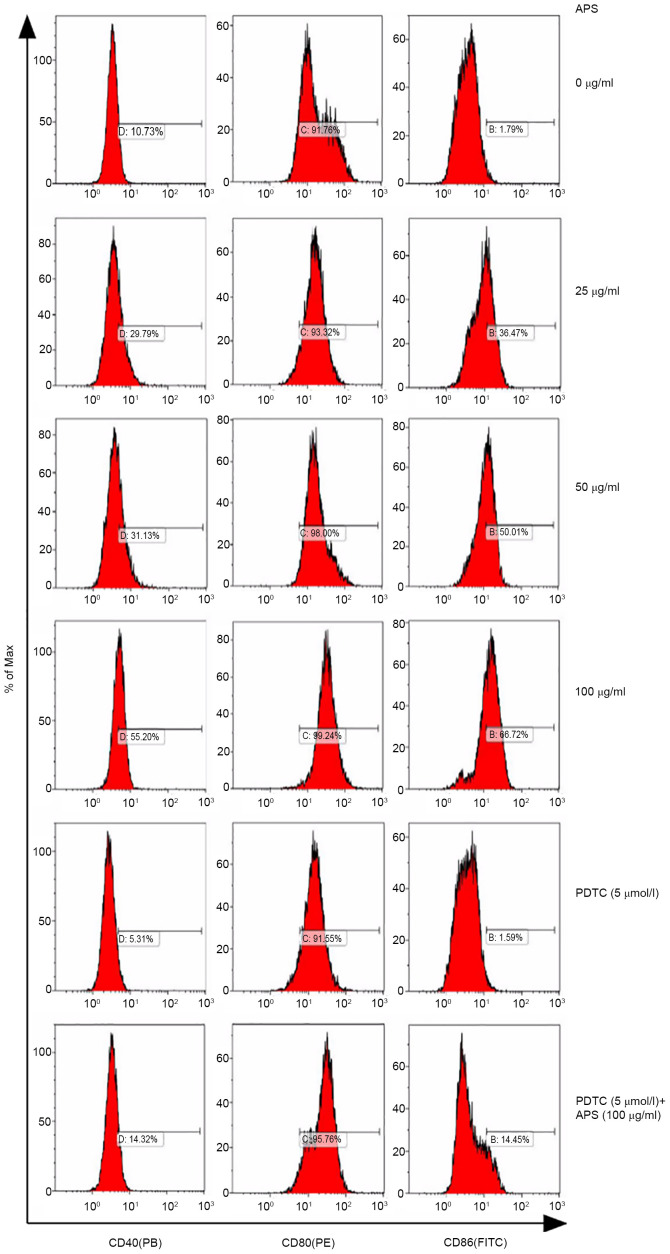
Figure 4.
Effects of APS on CD40, CD80 and CD86 secretion. Key membrane molecules were measured by flow cytometry. Cells were treated with different concentrations (0-100 µg/ml) of APS in the absence or presence of 5 µmol/ml PDTC. From left to right, expression of CD40 (PB), CD80 (PE) and CD86 (FITC). After the cell surface factors was detected by flow cytometry, the results were expressed in the histogram. APS, Astralagus polysaccharide; PDTC, pyrrolidine dithiocarbamate; PE, phycoerythrin.

