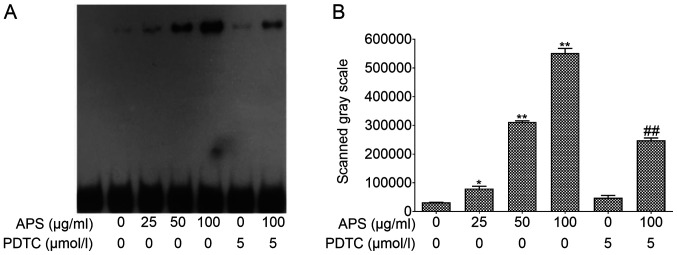
Figure 6.
Effects of APS on the expression of transcription factor p65 in the nucleus. (A) The electrophoretic mobility shift assay (EMSA) result of NF-κB p65. (B) The EMSA scanned gray scale of NF-κB p65. *P<0.05 and **P<0.01 vs 0 µg/ml APS treatment group. ##P<0.01 vs. 100 µg/ml APS treatment group. All values are expressed as the mean ± standard deviation of at least three replications in each treatment. APS, Astralagus polysaccharide; PDTC, pyrrolidine dithiocarbamate.

