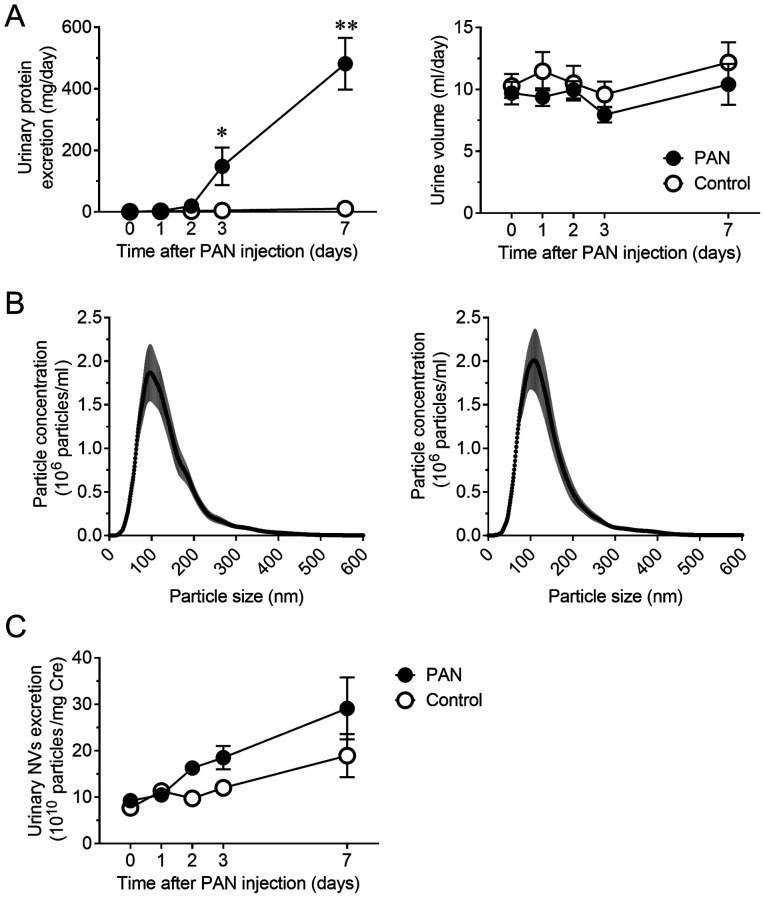
Figure 1.
Disease profile of the PAN nephritis model and excretion of NVs in urine. (A) Time course of urinary protein excretion (left) and urine volume (right) (n=8). (B) Size distribution of NVs in urine from control rats (left) and PAN nephritis model rats (right) on day 7 (n=8). The gray range represents the SEM. (C) Time course of urinary NV excretion (n=8). Data are presented as the mean ± SEM. *P<0.05, **P<0.01 vs. control group. PAN, puromycin aminonucleoside; NVs, nano-extracellular vesicles; SEM, standard error of the mean.

