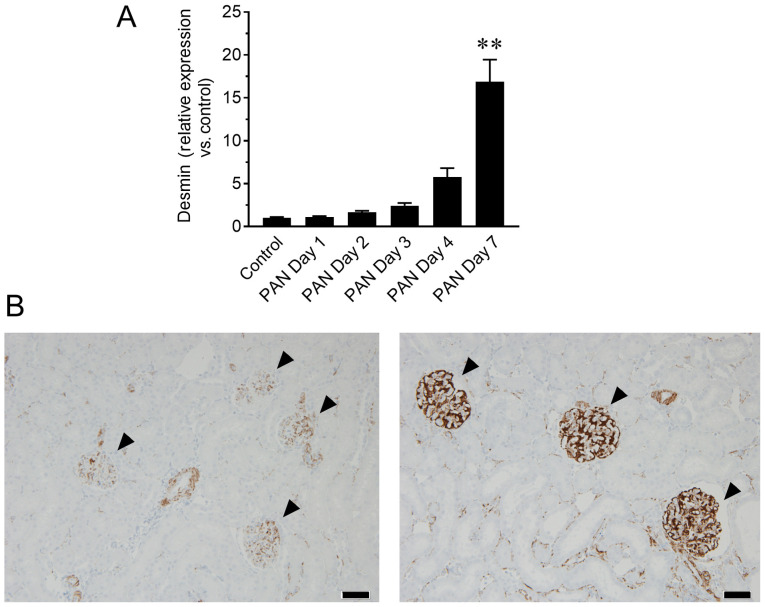
Figure 3.
Changes in desmin expression in glomeruli. (A) Changes in relative desmin gene expression in isolated glomeruli at different time-points. n=6-10. Data are presented as the mean ± standard error of the mean. **P<0.01 vs. control group. (B) Representative images of immunohistochemistry of desmin in the kidney of control (left) and PAN nephritis model (right) rats at day 7. Arrowheads, glomeruli. Scale bar, 50 µm. PAN, puromycin aminonucleoside.

