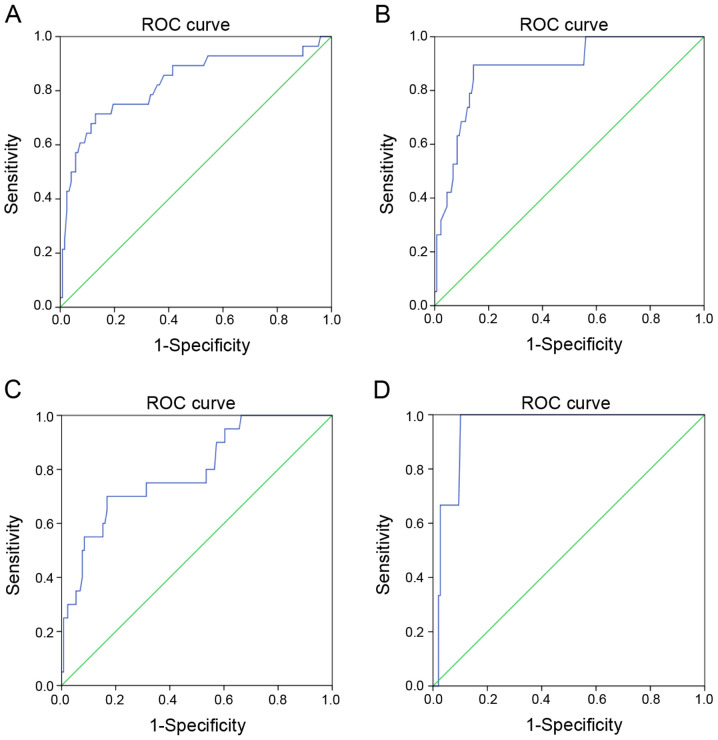
Figure 2.
ROC curves of PC volume in predicting in-patient outcomes. (A) ROC curves for PC volume and ARDS. AUC, 0.828; standard error, 0.050; 95% CI, 0.730-0.927; P<0.001. (B) ROC curves for PC volume and mechanical ventilation. AUC, 0.886; standard error, 0.040; 95% CI, 0.808-0.964; P<0.001. (C) ROC curves for PC volume and ICU admission. AUC, 0.793; standard error, 0.055; 95% CI, 0.684-0.901; P<0.001. (D) ROC curves for PC volume and mortality. AUC, 0.828; standard error, 0.025; 95% CI, 0.902-1.000; P=0.008. ROC, receiver operating characteristic; PC, pulmonary contusion; ARDS, acute respiratory distress syndrome; AUC, area under the curve; CI, confidence interval; ICU, intensive care unit.

