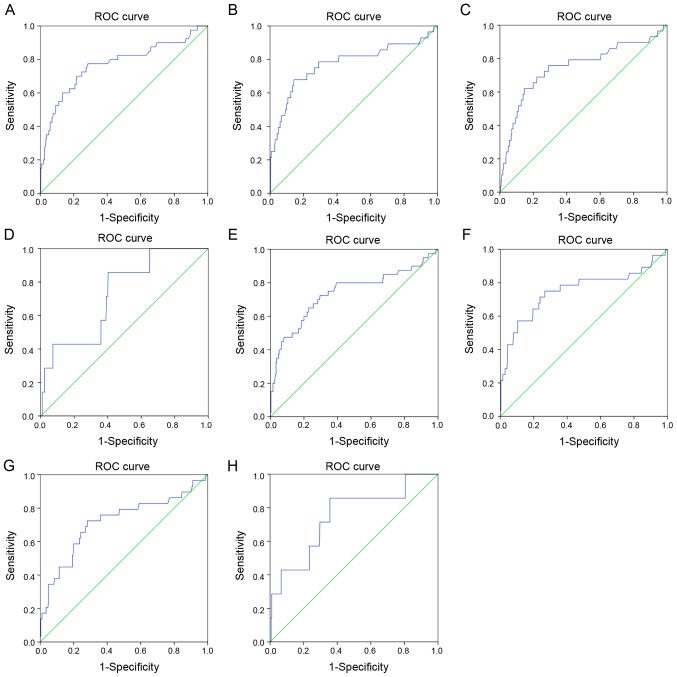
Figure 3.
ROC curves of IL-17 for predicting the in-hospital outcomes of patients. (A) ROC curves for IL-17 (day 1) and ARDS. AUC, 0.770; standard error, 0.047; 95% CI, 0.679-0.862; P<0.001. (B) ROC curves for IL-17 (day 1) and mechanical ventilation. AUC, 0.773; standard error, 0.058; 95% CI, 0.659-0.887; P<0.001. (C) ROC curves for IL-17 (day 1) and ICU admission. AUC 0.747; standard error, 0.057; 95% CI, 0.636-0.858; P<0.001. (D) ROC curves for IL-17 (day 1) and mortality. AUC, 0.727; standard error, 0.086; 95% CI, 0.558-0.897; P=0.040. (E) ROC curves for IL-17 (median) and ARDS. AUC, 0.737; standard error, 0.051; 95% CI, 0.638-0.837; P<0.001. (F) ROC curves for IL-17 (median) and mechanical ventilation, AUC, 0.752; standard error, 0.061; 95% CI, 0.632-0.871; P<0.001. (G) ROC curves for IL-17 (median) and ICU admission. AUC, 0.717; standard error, 0.059; 95% CI, 0.602-0.832; P<0.001. (H) ROC curves for IL-17 (median) and mortality. AUC, 0.747; standard error, 0.099; 95% CI, 0.552-0.941; P=0.026. ROC, receiver operating characteristic; IL, interleukin; ARDS, acute respiratory distress syndrome; AUC, area under the curve; CI, confidence interval; ICU, intensive care unit.

