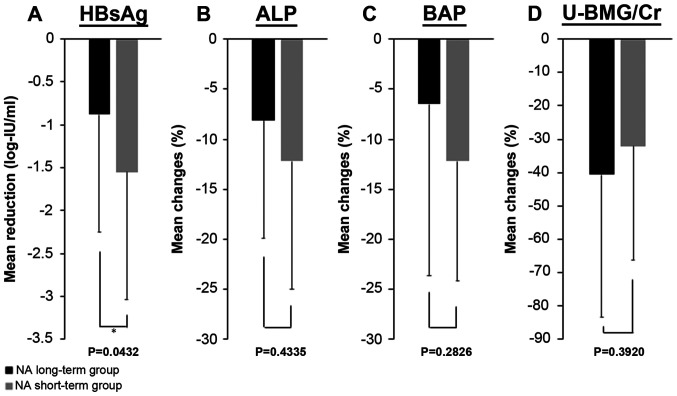
Figure 1.
Mean reduction or improvement rate from baseline to 6 months after tenofovir alafenamide switching between the NA long-term group and the short-term group. Results of (A) serum HBsAg levels, (B) serum ALP levels, (C) serum BAP levels and (D) U-BMG/Cr levels. *P<0.05. ALP, alkaline phosphatase; BAP, bone specific alkaline phosphatase; HBsAg, hepatitis B surface antigen; NA, nucleos(t)ide analogs; U-BMG/Cr, urine β2-microglobulin-creatinine ratio.

