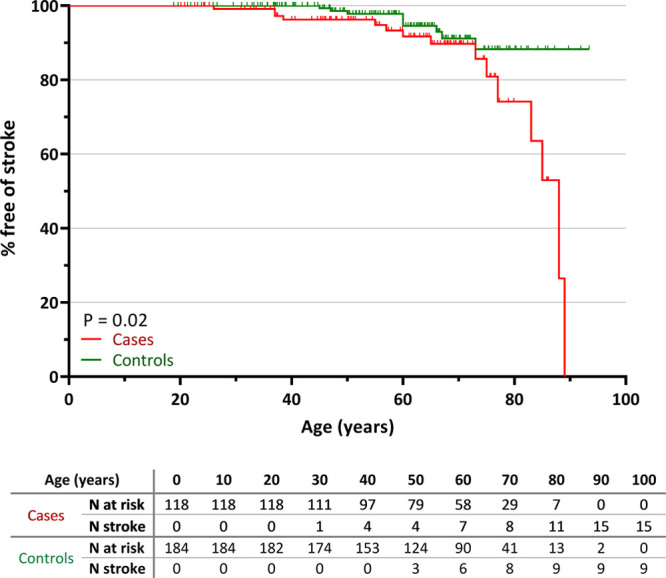
Figure 1.

Stroke incidence in cases with a NOTCH3cys variant vs controls. Kaplan-Meier plot showing the proportion free of stroke in cases (n=118) and controls (n=184). Cases had a significantly shorter stroke-free survival compared with controls (P=0.02). The table under the graph shows the number of cases and controls at risk and the number of individuals with a first stroke per 10-y interval.
