Figure 2.

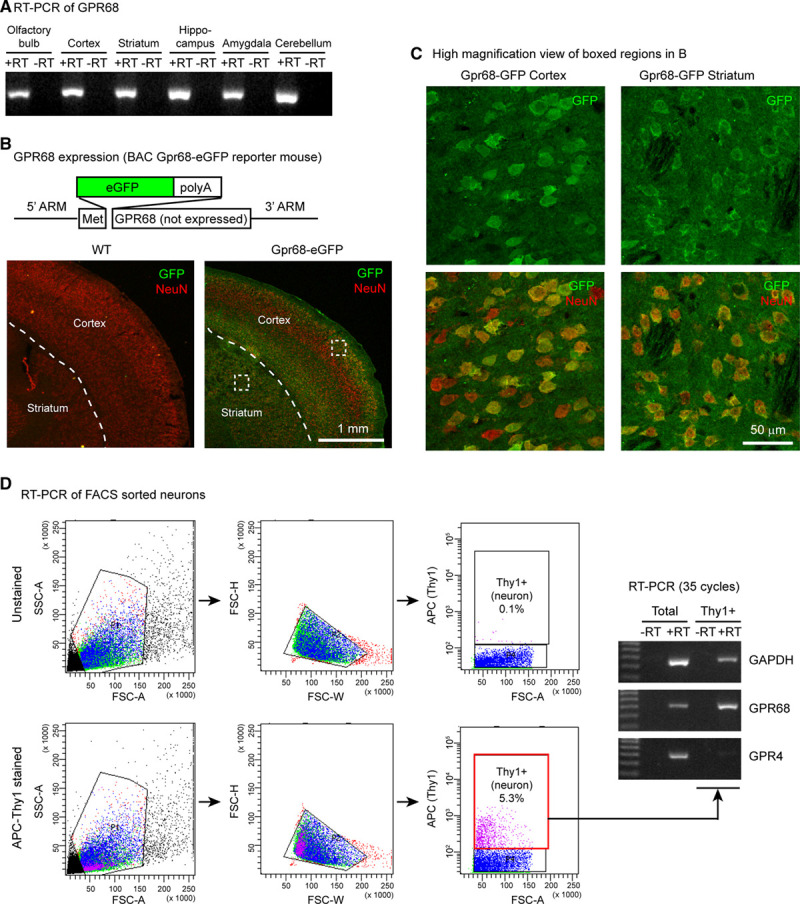
GPR68 expression in brain neurons. A, Reverse-transcription-polymerase chain reaction (RT-PCR) result on GPR68 expression in different regions of mouse brain. −RT has no reverse transcriptase added into RT. B, GFP expression in the Gpr68-eGFP reporter mouse line. Diagram illustrates the organization of the BAC transgene, in which eGFP was inserted after the first methione of GPR68. The GPR68 gene in the BAC chromosome was not expressed because of the addition of poly-A after eGFP coding. To visualize GFP signal, we performed immunofluorescence staining with an anti-GFP antibody, together with a NeuN antibody to identify neurons. Dashed lines outline the boundary between cortex and striatum. C, High magnification view of the boxed cortical and striatal regions in Gpr68-GFP image in (B). D, GPR68 expression in FACS-sorted neurons. Neurons were labeled with APC-conjugated Thy1 antibody. Left panels illustrate the gates and cell distribution of unstained (top) and antibody-stained samples. Gel images show RT-PCR result of total (unsorted) and Thy1+ (neuron) population. APC indicates allophycocyanin; BAC, bacterial artificial chromosome; eGFP, enhanced GFP; FACS, fluorescence-activated cell sorting; FSC, forward scatter; GFP, green fluorescent protein; and SSC, side scatter.
