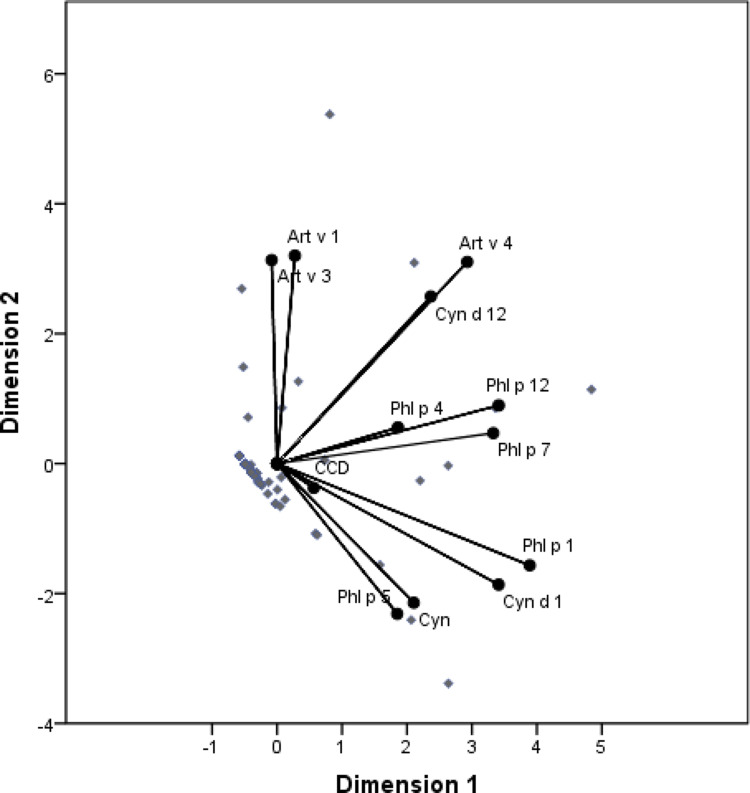
Figure 4.
Optimal scale analysis between Bermuda grass, Mugwort and Timothy grass allergen components and CCD. The distance between the points represents the relative strength of correlation between them. The optimal scale analysis shows that there is a close relationship between Cyn d 1 and Phl p 1 (Cronbach’s alpha = 85.1%).

