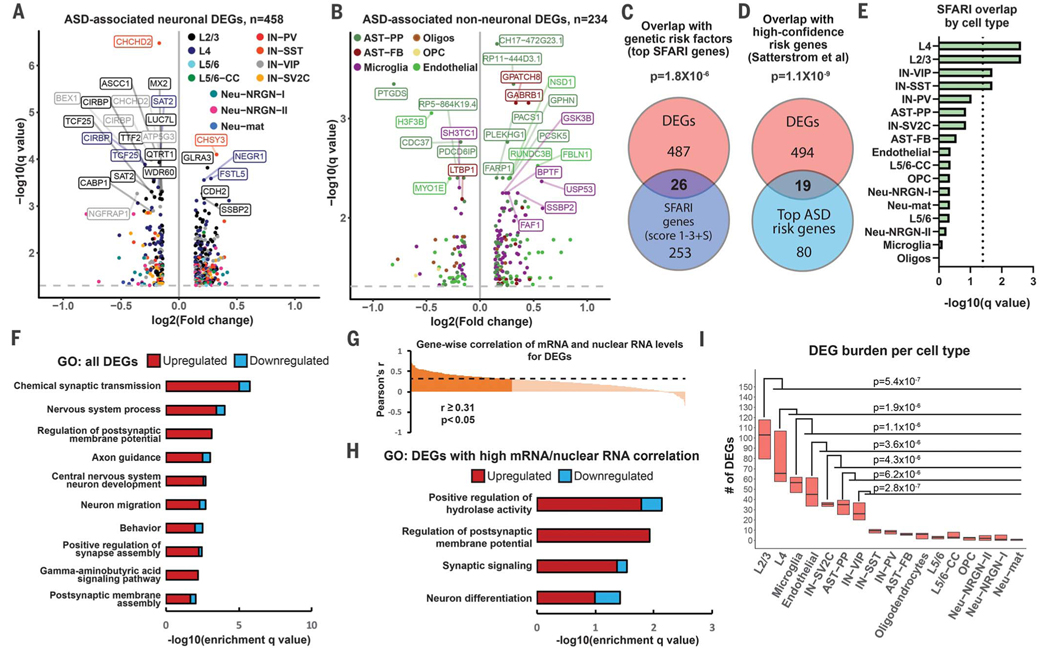
Fig. 2. Cell type–specific gene expression changes in ASD.
(A and B) Volcano plots for cell type–specific genes differentially expressed in neuronal (A) and non-neuronal cells (B). (C) Overlap between DEGs and top ASD genetic risk factors from the SFARI database (gene scores 1 to 3 and syndromic). (D) Overlap between cell type–specific DEGs and high-confidence ASD genetic risk factors based on whole-exome sequencing (35,584 ASD subjects). (E) Overlap between SFARI genes and DEGs; dotted line indicates statistical significance (q < 0.05). (F) Top biological pathways enriched for DEGs identified across all analyzed cell types. Bars represent numbers of up- and down-regulated genes in each GO term. (G) Correlation between mRNA and nuclear RNA for DEGs in the same tissue samples. (H) GO analysis for DEGs with significant mRNA–nuclear RNA correlation. (I) Burden analysis on downsampled data. P values were calculated by comparing numbers of DEGs between cell types (Mann-Whitney U test).

