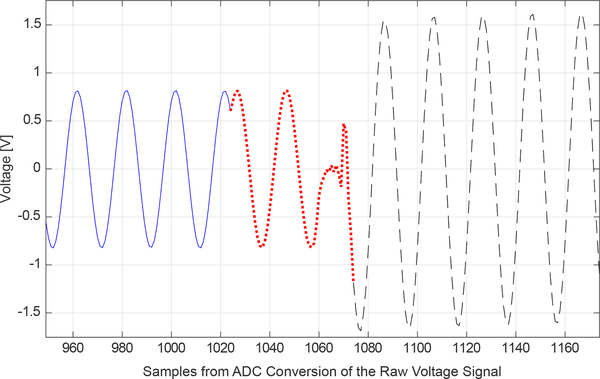
Fig. 3.
Samples located in the middle of the raw voltage signal of a single injecting channel can be used illustrate key components of ACE1 measurements. The 2048 samples in the raw voltage signal on a tank phantom was sampled at 2.5 MHz. The solid blue line is Ve. The dotted red line is and includes the discarded transient from the switching operation (1060–1070), and the dashed black line is .

