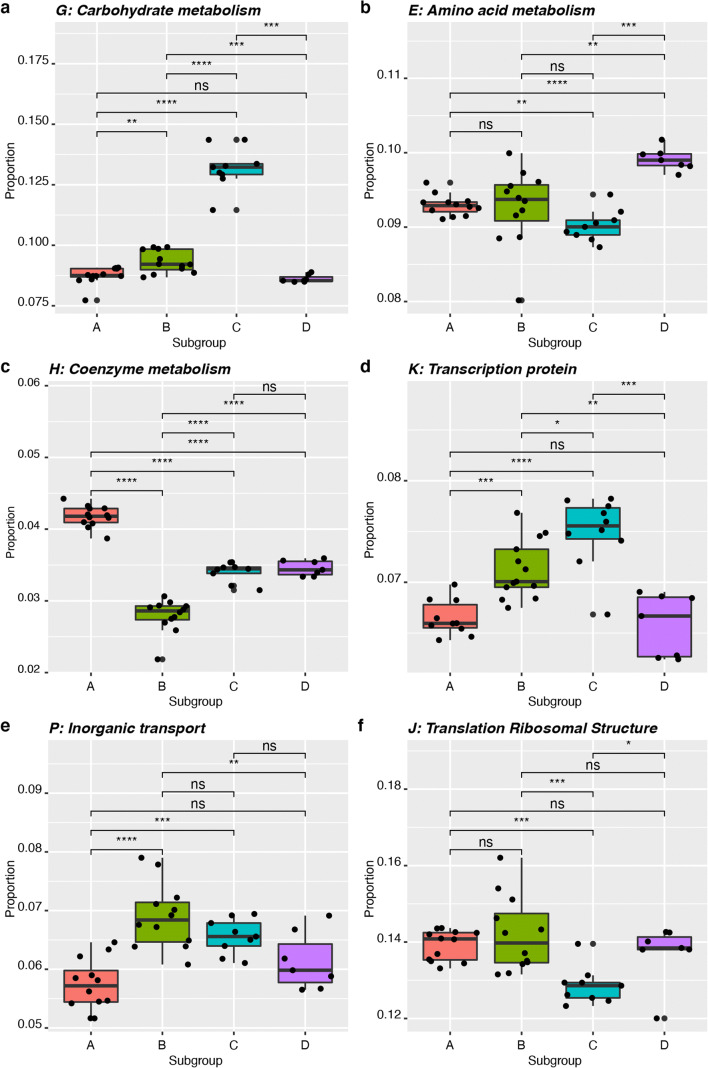
Fig. 3.
Differential abundance of six COG categories that were identified by SIMPER analysis as main drivers of subgroup separation. a Carbohydrate metabolism and transport proteins (category G), b amino acid transport and metabolism proteins (category E), c co-enzyme transport and metabolism proteins (category H), d transcription proteins (category K), e inorganic ion transport and metabolism proteins (category P) and f translation, ribosomal structure and biogenesis proteins (category J). Results of unpaired t tests are indicated where * is p ≤ 0.05, ** is p ≤ 0.01, *** is p ≤ 0.001, **** is p ≤ 0.0001 and ns is not significant

