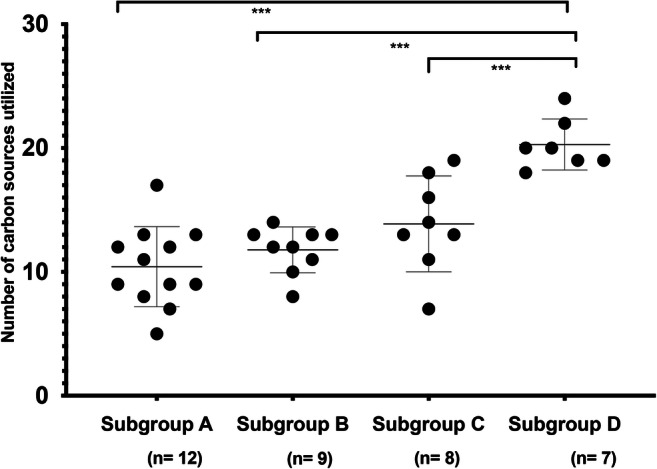
Fig. 4.

Comparison of numbers of carbon sources utilized by isolates in each subgroup. The number of carbon sources utilized by isolates in subgroup D was significantly higher than those in subgroups A, B and C (Tukey’s HSD, p ≤ 0.001). Only one-fourth (9/36) of the tested isolates utilized more than 17 carbon sources, including all seven tested isolates of subgroup D
