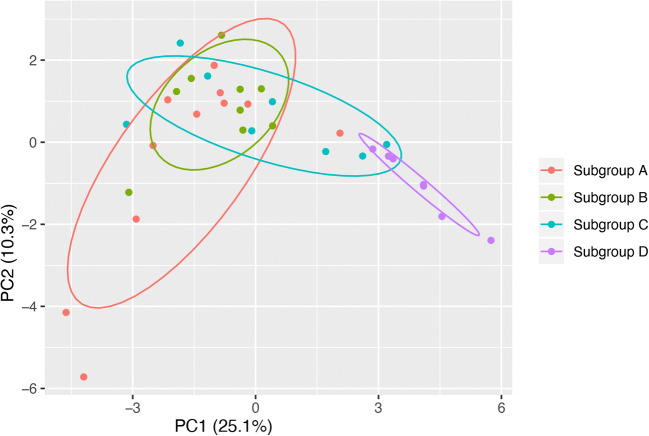
Fig. 5.
Subgroup D has minimal overlap with the other subgroups in carbon source utilization. The degree of variation based on carbon source utilization between subgroup D and subgroups A and B was significant (pairwise ADONIS, p < 0.05, after Bonferroni adjustment). The variation in carbon source utilization between subgroups C and D can be explained by subgroup affiliation in 39% of cases. Overall, 42% of differences in carbon sources utilization between subgroups can be explained by their subgroup affiliation (Adonis, R2 = 0.42, p < 0.05)

