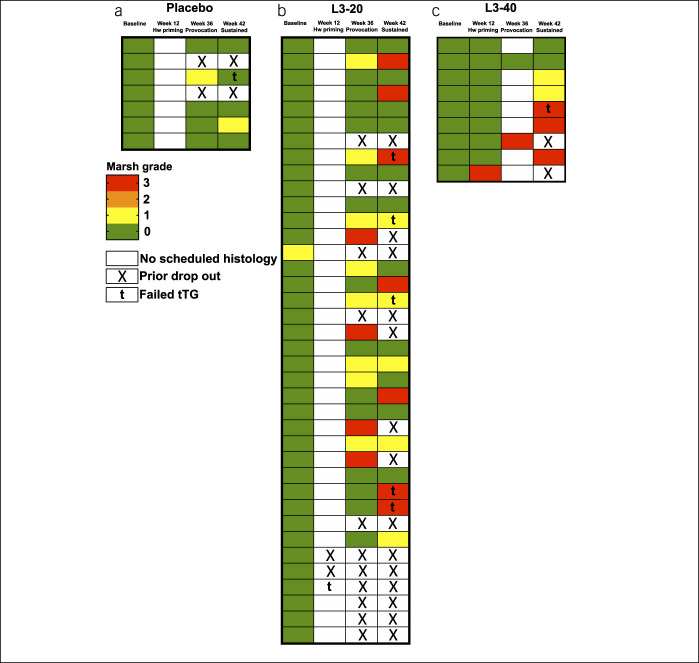
Figure 2.
Heat map displaying safety assessment outcomes and completion of study phases. Color-coded heat map displaying Marsh score, IgA-tTG safety assessment results and dropouts in the intention-to-treat (a) placebo, (b) L3-20, and (c) L3-40 cohorts at baseline and at designated visits after escalating gluten challenge. Marsh 3 represents failed histology; t denotes failed tTG assessment. Each row represents an individual participant. tTG, tissue transglutaminase.

