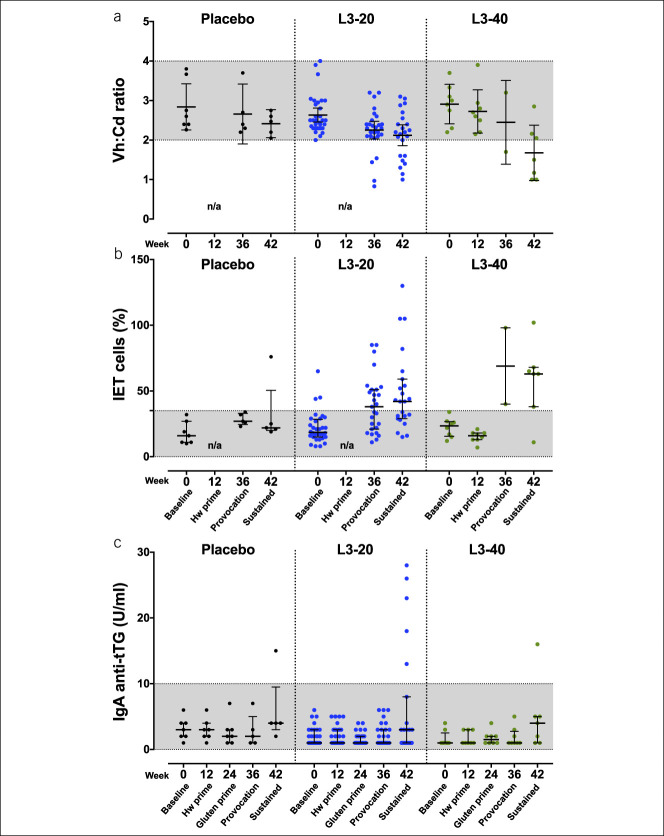
Figure 3.
Histology and serum autoantibody (anti-tTG) responses. (a) Duodenal villous height:crypt depth ratio (Vh:Cd, mean ± 95% CI) and (b) intraepithelial CD3+ T cell (IET cell) frequency (median ± IQR) in each individual's duodenal biopsy specimen at baseline and each study visit after intervention and escalating gluten challenge. (c) Serum IgA-tTG titers (median ± IQR) at baseline and each study visit. Dot points represent each individual's value and grayed area indicates the normal ranges for each parameter. CI, confidence interval; Hw, hookworm; IgA, immunoglobulin A; IQR, interquartile range; n/a, not applicable; tTG, tissue transglutaminase.

