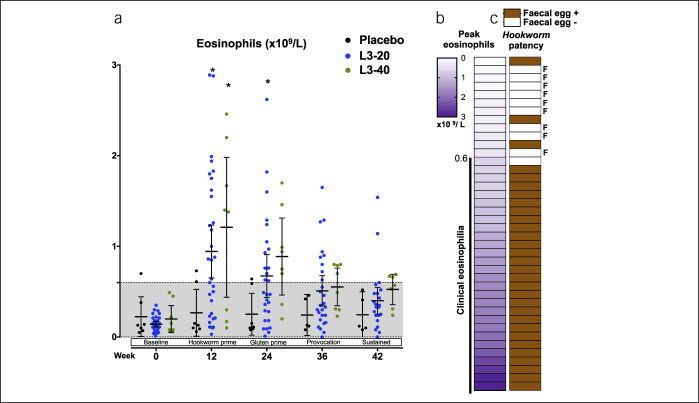
Figure 4.
Evaluation of establishment of hookworm infections. (a) Peripheral blood eosinophil counts at baseline, after treatment with placebo or hookworm L3, and after escalating gluten challenges. Each individual data point is shown along with mean ± 95% confidence interval. Grayed area indicates the normal range. (b) Peak eosinophil counts in each participant from the L3-30 or L3-40 cohorts were ranked from lowest to highest and correlated with the (c) detection of hookworm eggs in feces by quantitative polymerase chain reaction (patency). F denotes participants who demonstrated both a lack of clinical eosinophilia (<0.6 × 10⁹/L) and an absence of a patent hookworm infection (total of 9 participants were deemed to be “hookworm treatment failures”).

