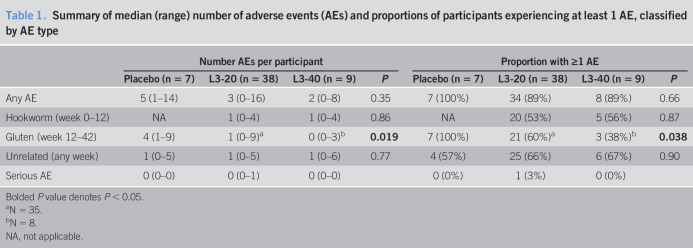
Table 1.
Summary of median (range) number of adverse events (AEs) and proportions of participants experiencing at least 1 AE, classified by AE type
| Number AEs per participant | Proportion with ≥1 AE | |||||||
| Placebo (n = 7) | L3-20 (n = 38) | L3-40 (n = 9) | P | Placebo (n = 7) | L3-20 (n = 38) | L3-40 (n = 9) | P | |
| Any AE | 5 (1–14) | 3 (0–16) | 2 (0–8) | 0.35 | 7 (100%) | 34 (89%) | 8 (89%) | 0.66 |
| Hookworm (week 0–12) | NA | 1 (0–4) | 1 (0–4) | 0.86 | NA | 20 (53%) | 5 (56%) | 0.87 |
| Gluten (week 12–42) | 4 (1–9) | 1 (0–9)a | 0 (0–3)b | 0.019 | 7 (100%) | 21 (60%)a | 3 (38%)b | 0.038 |
| Unrelated (any week) | 1 (0–5) | 1 (0–5) | 1 (0–6) | 0.77 | 4 (57%) | 25 (66%) | 6 (67%) | 0.90 |
| Serious AE | 0 (0–0) | 0 (0–1) | 0 (0–0) | 0 (0%) | 1 (3%) | 0 (0%) | ||
Bolded P value denotes P < 0.05.
N = 35.
N = 8.
NA, not applicable.

