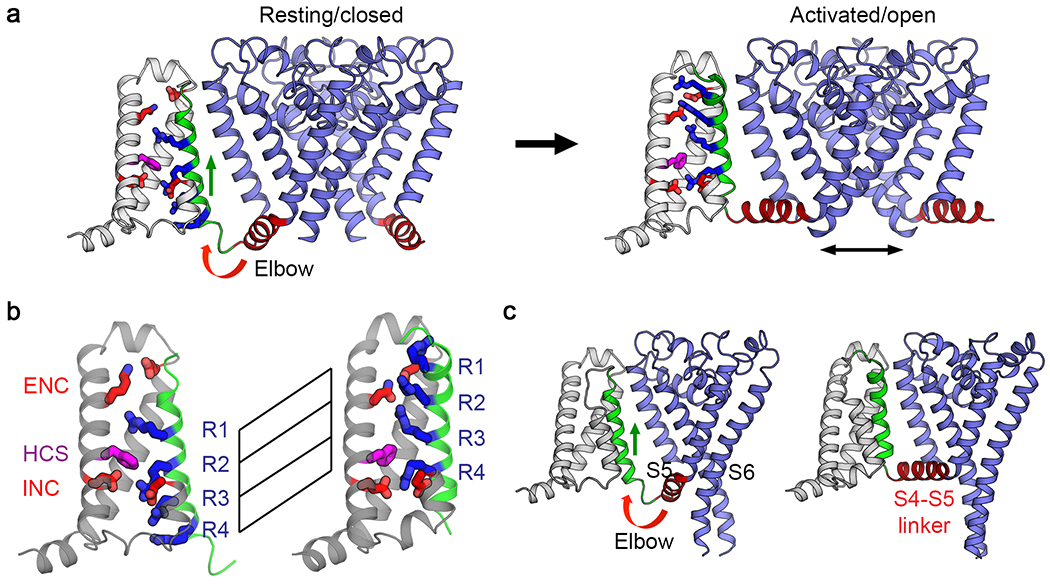
Figure 2. Comparison of NaVAb structures in the resting state and the activated state7,10.
a, Structural transition between resting/closed and activated/open states. Structures in the resting/closed state (left) and activated/open state (right) are captured from Movie S1 and illustrated as backbone cartoons with only one voltage sensor shown for clarity. S4 is green, and important sidechains in the voltage sensor are shown as sticks colored as in Figure 1. b, Gating charge movement. Four Arg gating charges R1-R4 are shown in blue, the extracellular negative cluster (ENC) of E32 and N49 and intracellular negative cluster (INC) of E59 and E80 in red. Phe in the hydrophobic constriction site (HCS) is shown in purple. S4 (green) moves outward by 11.5 Å, passing two gating charges through the HCS. Part of S3 is omitted for clarity. c, Side view of the structures focusing on S4 (green) and the S4-S5 linker (red). The S4 segment moves outward across the membrane from the resting to the activated states while the S1 to S3 segments rotate slightly but remain essentially unchanged with respect to their original transmembrane position. The S4-S5 linker is illustrated as an elbow that connects the S4 movement to gating of the pore.

