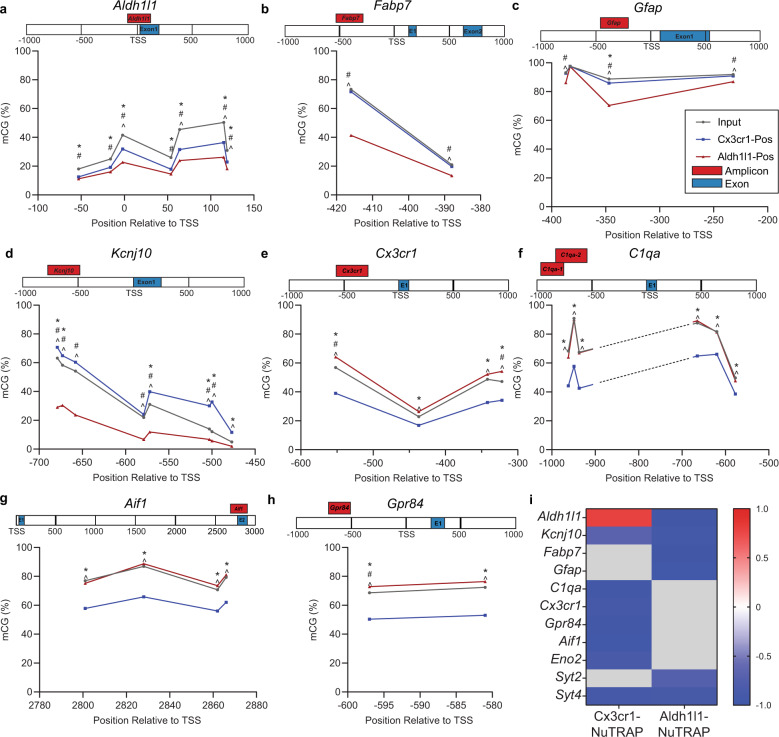
Fig. 10. CG methylation (mCG) in specific gene promoters and intragenic regions in Cx3cr1-NuTRAP and Aldh1l1-NuTRAP mouse brain and correlation of gene promoter methylation with gene expression.
a–h Schematic of locations of targeted BSAS amplicons relative to TSS and exons of astrocytic (Aldh1l1, Fabp7, Gfap, and Kcnj10) and microglial (Cx3cr1, C1qa, Aif1, Gpr84) cell marker genes. Average methylation (% mCG) at each CG site within the displayed amplicon is plotted for Input, Cx3cr1-NuTRAP positive fraction (Cx3cr1-Pos), and Aldh1l1-NuTRAP-positive fraction (Aldh1l1-Pos). Topography of site-specific mCG appears to be well-conserved across fractions, despite significant differences in overall mCG between fractions. Sites with differential methylation are noted (n = 6/group; Two-way ANOVA with Tukey’s post-hoc; *p < 0.05 Input vs Cx3cr1-Pos, #p < 0.05 Input vs Aldh1l1, ^p < 0.05 Cx3cr1-Pos vs Aldh1l1-Pos). a–d With few exceptions, each CG site within examined astrocytic marker gene regions (Aldh1l1, Fabp7, Gfap, and Kcnj10) has lower mCG in Aldh1l1-Pos than both Input and Cx3cr1-Pos. e–h Most CG sites within examined microglial marker gene regions (Cx3cr1, C1qa, Aif1, Gpr84) are lower in Cx3cr1-Pos than both Input and Aldh1l1-Pos. i Average mCG across each region analyzed was correlated to gene expression (normalized RQ) (Supplemental Fig. 16). Significant correlation coefficients (Pearson r; Bonferroni correction for multiple comparisons; p < 0.0045) displayed in the heatmap show strong negative correlation between mCG and gene expression in: astrocytic marker genes (Aldh1l1, Fabp7, Gfap, and Kcnj10) for the Aldh1l1-NuTRAP model and microglial marker genes (Cx3cr1, C1qa, Aif1, Gpr84) for the Cx3cr1-NuTRAP model. Neuronal genes (Eno2, Syt2, Syt4) CG methylation had negative correlations to gene expression in at least one model.

