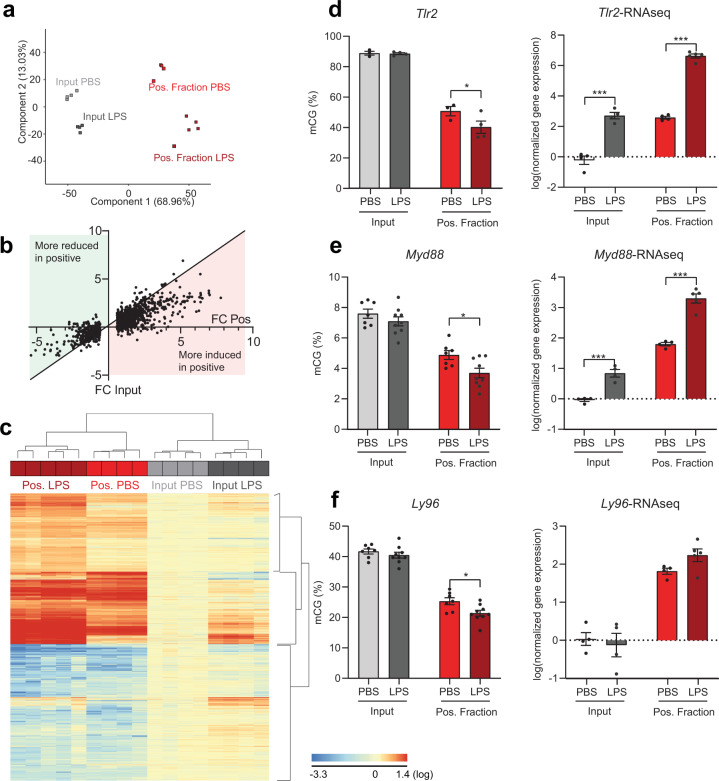
Fig. 11. RNAseq analysis of microglial transcriptome and targeted BSAS in specific gene promoters 24 h after LPS challenge in Cx3cr1-NuTRAP mouse brain.
Cx3cr1-NuTRAP mice were treated with LPS or PBS as control for 24 h. a RNAseq was performed and principal component analysis of transcriptome profiles showed separation of positive fraction (PBS- and LPS-treated) from input (PBS- and LPS-treated) samples by the first component, as well as subclustering based on treatment within input and positive fraction samples by the second component. b Fold change of genes differentially expressed after LPS in the positive fraction were compared to the fold change in the positive fraction. LPS induced larger changes when microglial RNA is isolated by TRAP. c RNAseq heatmap graph of cell-type marker genes from prior cell-sorting studies shows hierarchical clustering differentiating input from positive fractions and secondly comparing treatment within type of fraction. d, e Tlr2 and Myd88 promoter methylation (mCG) decreases with LPS challenge in the positive fraction but not in the input, in correlation with increased Tlr2 and Myd88 gene expression in the positive fraction, as shown by RNAseq analysis. f Ly96 promoter methylation decreases in the positive fraction with LPS challenge, while a trend toward increased gene expression after LPS in the positive fraction is observed by RNAseq. n = 4/group for Tlr2 and n = 7/group for Ly96 and Myd88. RNAseq: n = 4/PBS groups, n = 4/LPS input group, and n = 5/LPS-positive fraction group. *p < 0.05, **p < 0.01, ***p < 0.001 by Multiple t-test with Holm–Sidak correction for multiple comparisons.

