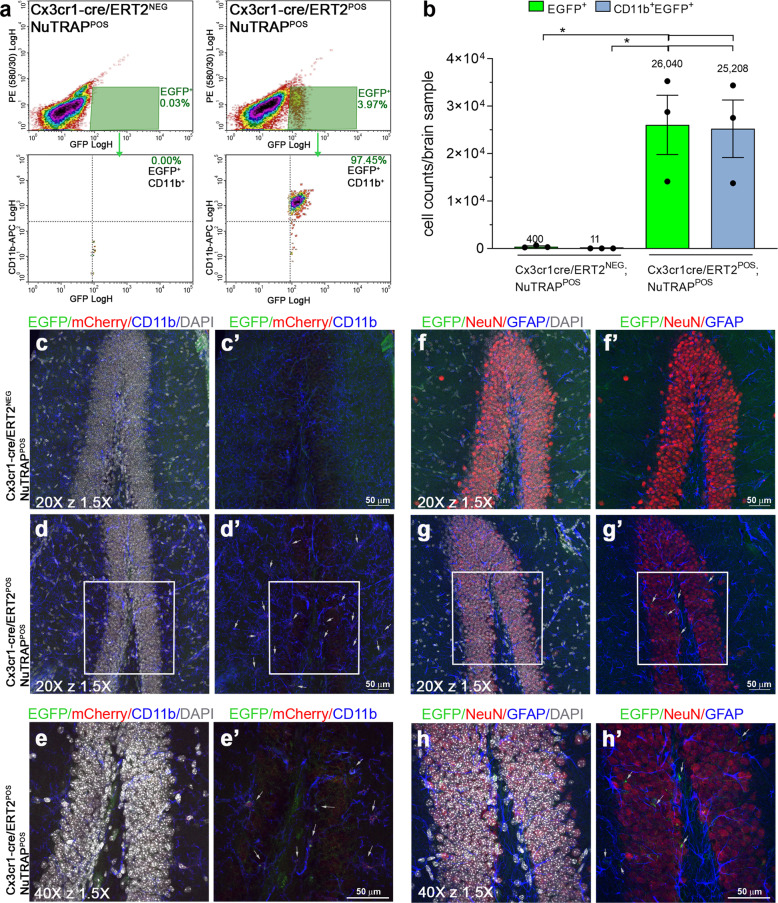
Fig. 5. Flow cytometry and immunohistochemical validation of the Cx3cr1-NuTRAP mouse brain.
After Tam treatment, brains from Cx3cr1-NuTRAP and cre-negative NuTRAP+ (control) mice were harvested and single hemispheres assessed by flow cytometry (FC) and immunohistochemistry (IHC). a Representative FC plots of immunostained single-cell suspensions showed a distinct population of brain EGFP+ cells, identified as CD11b+ cells (microglia lineage), based on gating strategy for EGFP and CD11b co-expression in Cx3cr1-NuTRAP samples upon cre-mediated recombination but not in the controls. b Analysis of absolute cell counts from FC quantitation expressed as mean cell count/brain sample ±SEM. c–h’ Representative confocal fluorescent microscopy images of sagittal brain sections captured in the dentate gyrus of the hippocampus. EGFP expression (green signal) was found in cells that co-expressed mCherry (red signal) and CD11b (blue signal) in Cx3cr1-NuTRAP+ brains. *p < 0.05 between depicted groups by one-way ANOVA followed by the Tukey’s multiple comparison test (n = 3/group). Scale bar at ×20 z ×1.5 and scale bar at ×40 z ×1.5: 50 µm.

