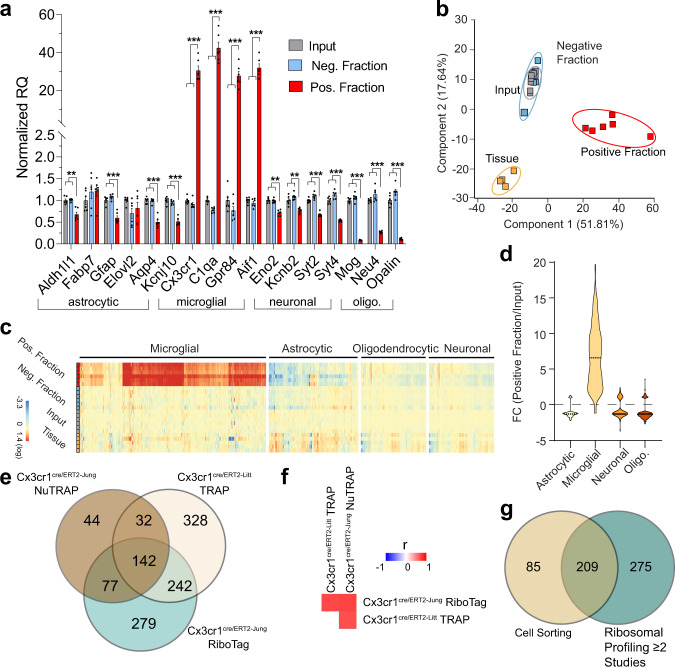
Fig. 6. Validation of microglial TRAP-RNA enrichment in the Cx3cr1-NuTRAP mouse brain.
a TRAP-isolated RNA from input, negative, and positive fractions were examined by qPCR for enrichment/depletion of selected cell-specific genes for microglia, astrocytes, oligodendrocytes, and neurons. Bar graphs represent average relative gene expression ± SEM. *p < 0.05, **p < 0.01, ***p < 0.001 by RM one-way ANOVA with Benjamini–Hochberg procedure to correct for multiple comparisons of genes followed by Tukey’s multiple comparison test of fractions (n = 6/group). b Principal component analysis of transcriptome profiles showed separation of positive fraction from input, negative and tissue samples by the first component. c RNAseq heatmap graph of cell-type marker genes from prior cell-sorting studies shows enrichment of microglial marker genes and depletion of other cell-type markers, as compared to whole tissue, input, and negative fractions. d Marker gene lists for different cell types were generated from cell-sorting studies as described in the text. Enrichment or depletion of genes from each of the lists is presented as the fold change (Positive fraction/Input). Microglial marker genes were enriched in the positive fraction while genes from other cell types were generally depleted in the positive fraction relative to input. e Microglia marker genes with FC > 5 (Positive fraction/Input) from the Cx3cr1-cre/ERT2+ model with RiboTag5, Cx3cr1-cre/ERT2+ model with TRAP3, and NuTRAP identifies 142 ribosomal-tagging common microglial marker genes. f Pearson correlation of the fold change (Positive fraction/Input) for all expressed genes observed in all studies have similar levels of transcriptome enrichment and depletion. g Comparison of 484 microglial markers from at least two ribosomal profiling studies with previously identified microglial markers from cell-sorting studies18 identifies 209 isolation method-independent microglia marker genes.

