Figure 6.
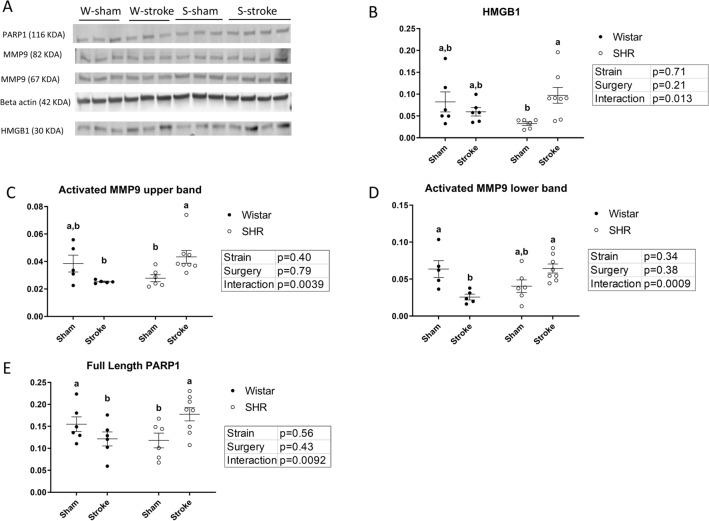
SHRs display increases in markers of neuronal damage following stroke that are not increased in normotensive animals. (A) Representative image for Western blot data. (B) Stroked SHR show increase in HMGB1 (p (interaction) < 0.05, 2-way ANOVA). (n = 4–8, per group). (C) and (D) Stroked SHRs show increase in activated MMP9 (p (interaction) < 0.01 for upper band and < 0.001 for lower band, 2-way ANOVA). Stroked SHRs show an increase of activated MMP9 (p < 0.05 for upper band and < 0.01 for lower band, Bonferroni post-hoc test) (n = 4–8, per group). (E) SHR show increase in full-length PARP1 after stroke (p (interaction) < 0.01, 2-way ANOVA). Stroked SHR show an increase of PARP1 compared to stroked Wistars (p < 0.05, Bonferroni post-hoc test) (n = 4–8, per group). (a,b: Tukey post-hoc multiple comparisons, pairs of means with different letters are significantly different).

