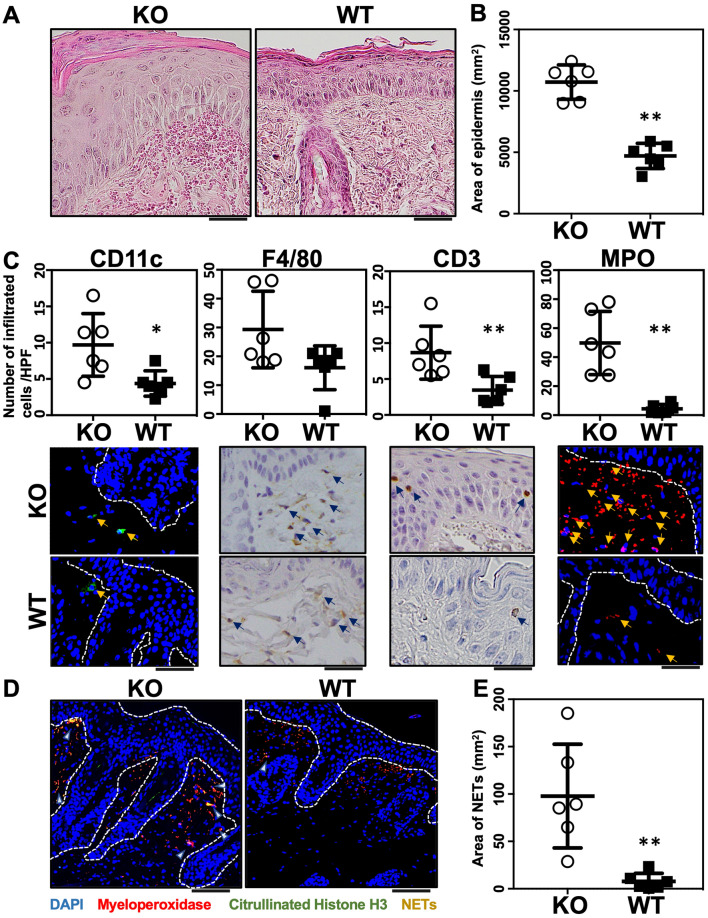
Figure 2.
Area of epidermis, numbers of infiltrated neutrophils and neutrophil extracellular trap (NET) formation. (A) Histological images of skin sections from WT and Il36rn−/− mice 3 days after topical imiquimod (IMQ) application. Scale bars, 100 µm. (B) The epidermal area within a distance of 10 mm was measured using ImageJ software (n = 6 animals/group; **p < 0.01 versus WT). (C) Numbers of infiltrated cells/high-power fields in back skin cross-sections from IMQ-treated Il36rn−/− and WT mice (100 × magnification, nine sections per mouse, n = 6 animals/group; * p < 0.05, **p < 0.01 versus WT). Representative photos of CD11c, F4/80, CD3, and MPO. Arrow shows positive cells. (D) Enhanced NETosis (arrows) in the dermis of IMQ-treated Il36rn−/− mice. Nuclear staining: 4′,6-diamidino-2-phenylindole (blue). Representative immunofluorescence image of NET structures stained with myeloperoxidase (red) and citrullinated histone (green). Scale bar, 50 μm. (E) Area of NETs/high-power fields in back skin cross-sections from IMQ-treated Il36rn−/− and WT mice (40 × magnification, nine sections per mouse, Mann–Whitney U test, n = 6 animals/group; **p < 0.01 versus WT).

