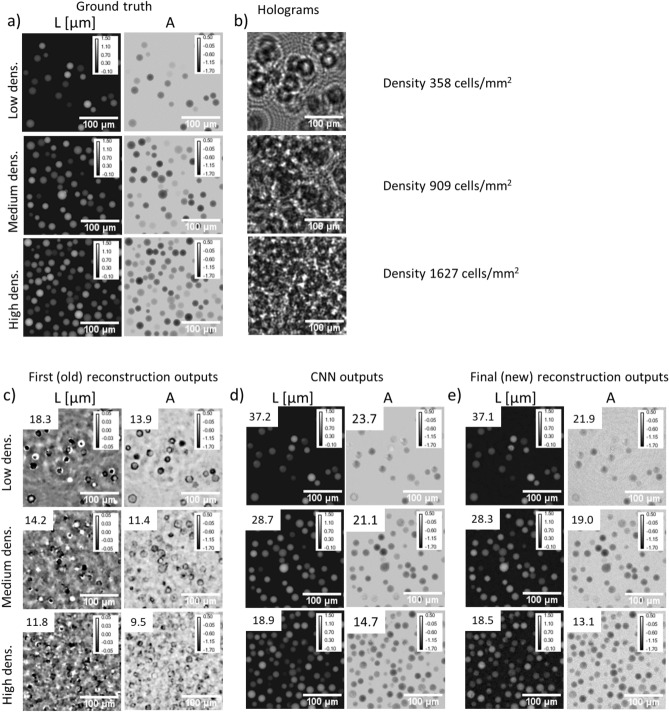
Figure 2.
Results of the alternation reconstruction method obtained on the synthetic validation set at low density (358 cells/), medium density (909 cells/) and high density (1627 cells/). Subfigure (a) presents ground truth images (L and A) of the object, subfigure (b) presents holograms obtained by using Eq. (2). Results of first (old) holographic reconstruction (c), of the CNN step (d), and of the final (new) reconstruction (e). Images are pixels crops of the original images ( pitch). In (c,d,e), peak signal-to-noise ratio (PSNR) measurements are indicated in the top left of the results to assess the reconstruction versus ground truth.

