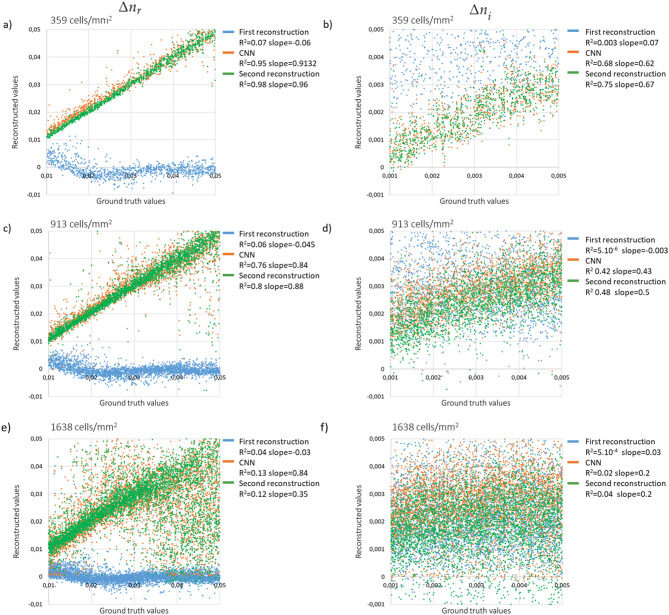
Figure 3.
Reconstructed and as a function of the ground truth values. The three lines of the figure correspond to three different cell densities, namely 358, 909 and 1627 cells/ (see corresponding images in Fig. 2). The results obtained after each individual step of the alternation approach are shown, namely the first reconstruction (blue dots), the CNN output (orange dots) and the final reconstruction (green dots). The results of the linear regressions are indicated with values of slope and coefficient of determination ().

