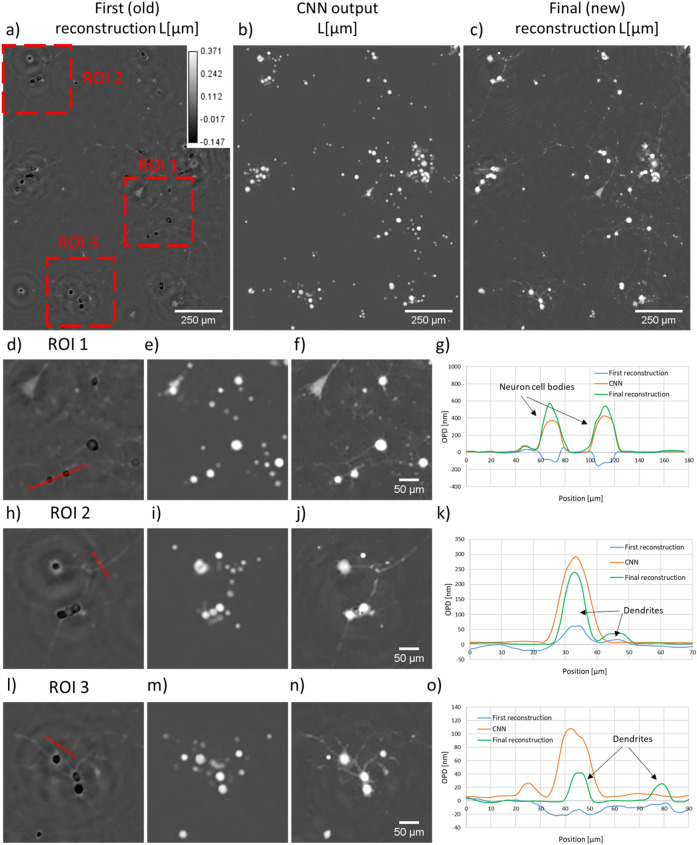
Figure 6.
Results of the alternation reconstruction method applied to adherent PC12 cells treated with neuron growth factor. The first reconstruction results is shown in (a), CNN result in (b) and final reconstruction result in (c). (d–o) present detailed results corresponding to three regions of interest depicted by red boxes in (a). (g) OPD profile through two neuron cell bodies (red line in (d)). (k) OPD profile through two dendrites (red line in (h)). (o) OPD profile measured at the proximity of a cell, through two dendrites (red line in (l)).

