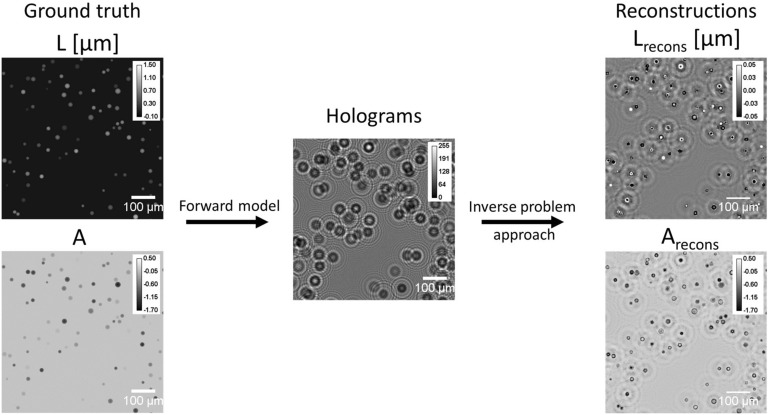
Figure 8.
Overview of the synthetic data generation method. A pair of synthetic images (ground truth) is generated, representing cells in suspension (L denotes the optical path difference and A the absorption). Using Eq. (2), the simulated intensity measurement image I is obtained for a given sample-to-sensor distance Z. The first reconstruction applied to I generates the simulated images and . The presented images are pixels ( pitch) crops of an image with cells corresponding to a density of 358 cells/.

