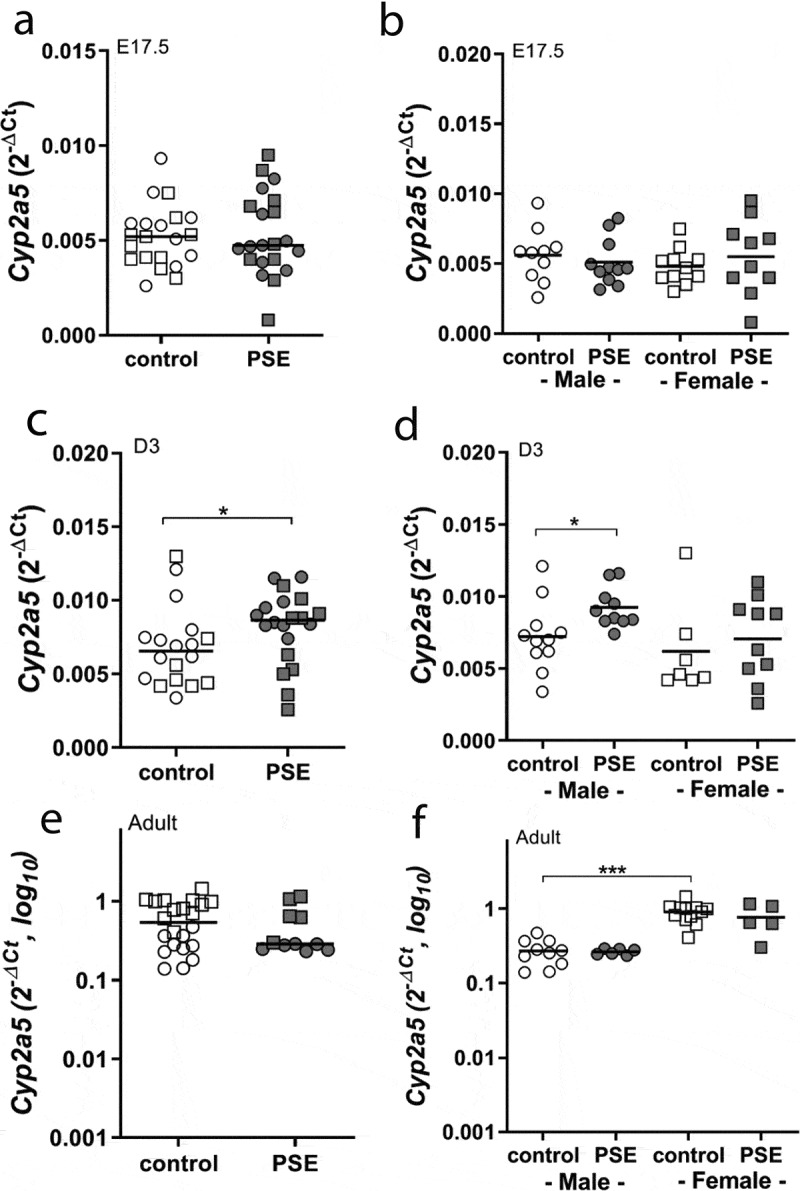
Figure 1.

Cyp2a5 expression in liver of PSE and control in E17.5, D3 mice and adult offspring
Cyp2a5 mRNA expression in whole liver of foetal offspring (E17.5, a and b), neonatal offspring (D3, c and d) and adult offspring (e and f) in PSE (closed symbols) and control groups (open symbols). Data are shown as individual values. If not stated otherwise, the comparison of shown groups was not significant. (Mann–Whitney U-test). *p ≤ 0.05, *** p ≤ 0.001 (Mann–Whitney U-test). Circle (○) symbol(s) = male, square (□) symbol(s) = female.
