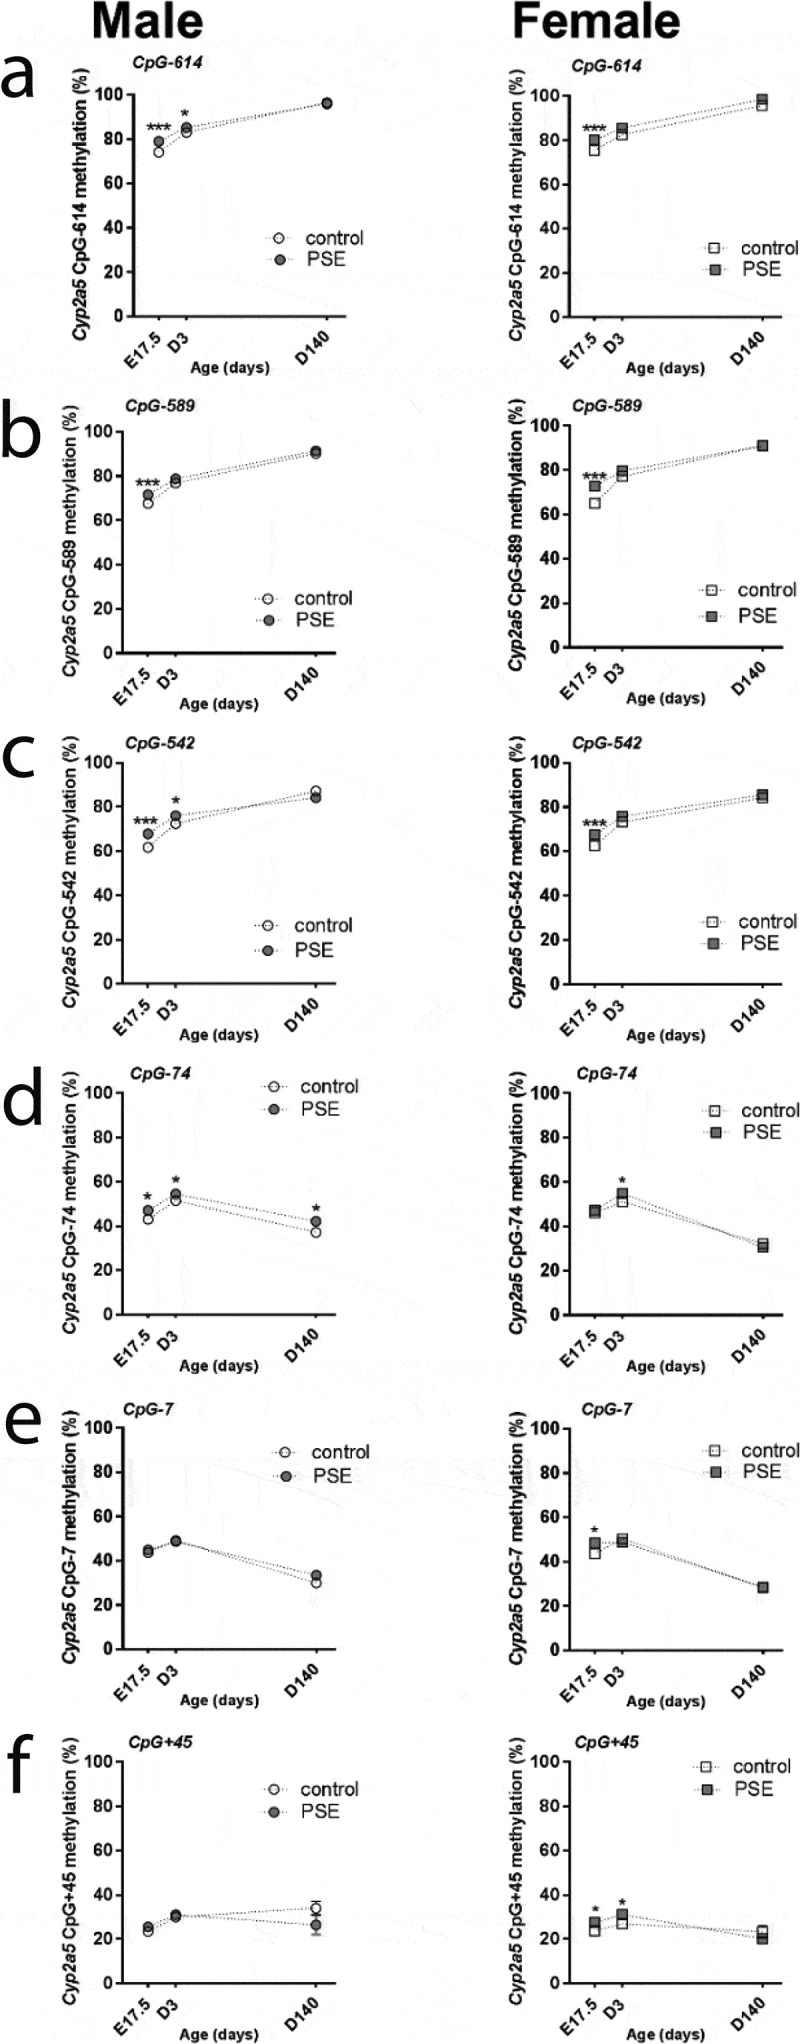
Figure 3.

Time points comparisons of sex-dependent Cyp2a5 promoter methylation status in PSE and control groups. The ANOVA test was used to do the comparison analysis among the foetal stage (E17.5), neonatal period (D3 means three days after birth) and adulthood (D140 means 140 days later after birth). P-values<0.0001 were detected by ANOVA test in all of CpG sites over three time points. Mann–Whitney U-test was used to test the comparisons between two time points in control (open symbols) and PSE (closed symbols) groups for 6 promoter methylation CpG sites. Data are represented as mean± SEM; CpG-site annotations are relative to the ATG start codon. *p ≤ 0.05, *** p ≤ 0.001 (Mann-Whitney U-test). Circle (○) symbol(s) = male, square (□) symbol(s) = female
