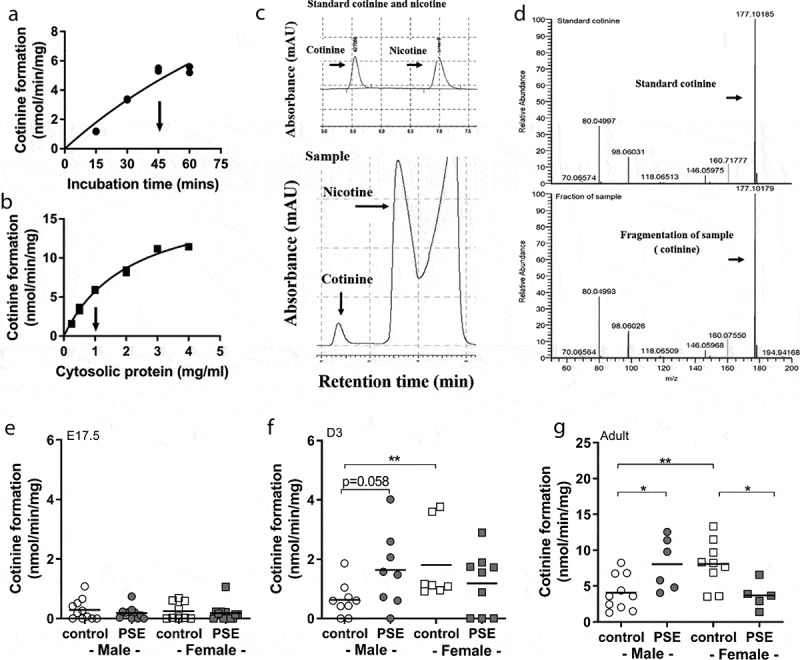
Figure 4.

Optimization and the cotinine formation levels of in vitro nicotine metabolism in E17.5, D3 mice and adult offspring. Cotinine formation of nicotine metabolism of foetuses (E17.5), three-day-old offspring (D3) and adult offspring in PSE and control groups. The nicotine metabolism was measured by HPLC-L as described in the material and methods section. The assay was optimized with respect to incubation time (a) and cytosolic protein concentration (b). Arrows at the X-axis indicate conditions used for actual experiments. C presents the HPLC chromatogram separation of a blank sample containing the standards nicotine and cotinine and the cotinine was produced in liver microsomes of PSE male neonatal offspring. D presents the cotinine analysis by LCMS. Cotinine, corresponding with m/z 177 was detected both in standard cotinine and in the microsome sample. The levels of cotinine formation were measured in foetal (e), three-day-old offspring (f) and adult offspring (g) of both groups. Circle (○) symbol(s) = male, square (□) symbol(s) = female. Data are shown as individual values. If not stated otherwise, the difference between groups was not significant. *p ≤ 0.05, ** p ≤ 0.01 (Mann-Whitney U-test). Open symbol(s) = control group, closed symbol(s) = PSE
