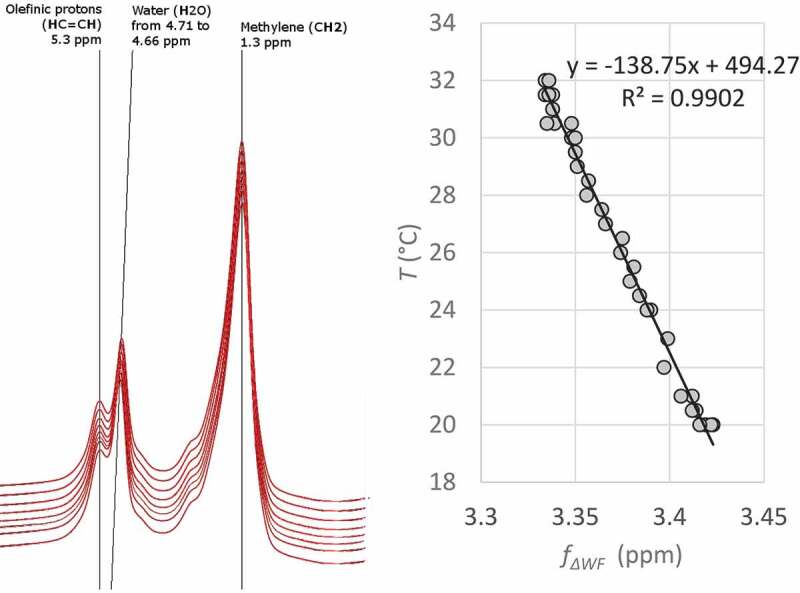
Figure 3.

An example of the temperature dependence of the frequency difference between water and fat. A test tube containing 50 ml of margarine (fat content 82%, approximately the same as a mixture of white and brown adipocytes in human supraclavicular adipose tissue) was heated from 20°C to 32°C while MR spectra were measured from a single voxel (size: 10 × 10 x 30 mm3). Simultaneously an external thermometer was used for acquiring the temperature. Left: Few spectra at different phases of heating. Right: The frequency difference between water and methylene signal of fat plotted against temperature to show the correlation between the frequency difference and temperature. Reprinted with permission from [13]
