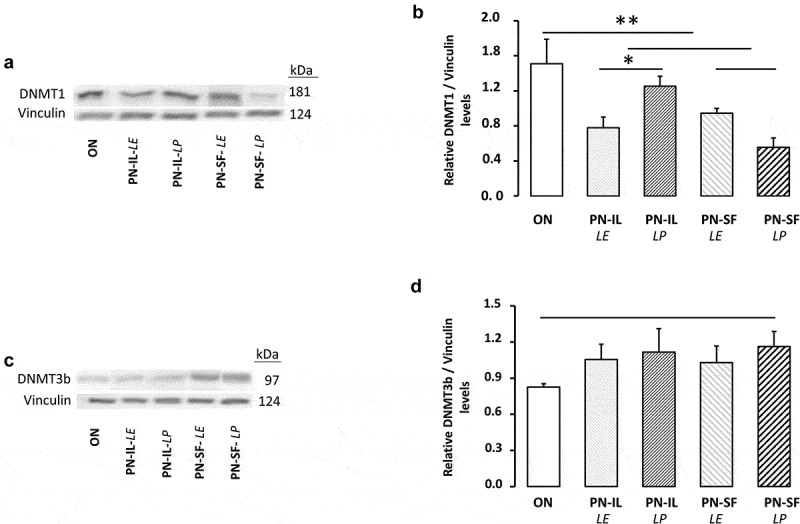
Figure 4.

DNMT1 and DNMT3b protein levels depending of nutritive modalities
ON: animals fed regular food; PN-IL-LE: animals fed exclusively with total parenteral nutrition (PN) compounded with Intralipid without photoprotection; PN-IL-LP: photoprotected PN compounded with Intralipid; PN-SF-LE: PN compounded with SMOFLipid without photoprotection; PN-SF-LP: photoprotected PN compounded with SMOFLipid. Panel A and B: DNMT1 protein levels were lower in PN groups compared to ON groups. Exposure to light was significant only in the PN-IL groups. Panel C and D: Western blot of DNMT3b protein levels showed no statistical difference between groups. Data are expressed as mean ± s.e.m., n = 7–8 per group. The bars show the statistical comparisons. The absence of a symbol on the bar means that p > 0.05. *: p < 0.05; **: p < 0.01.
