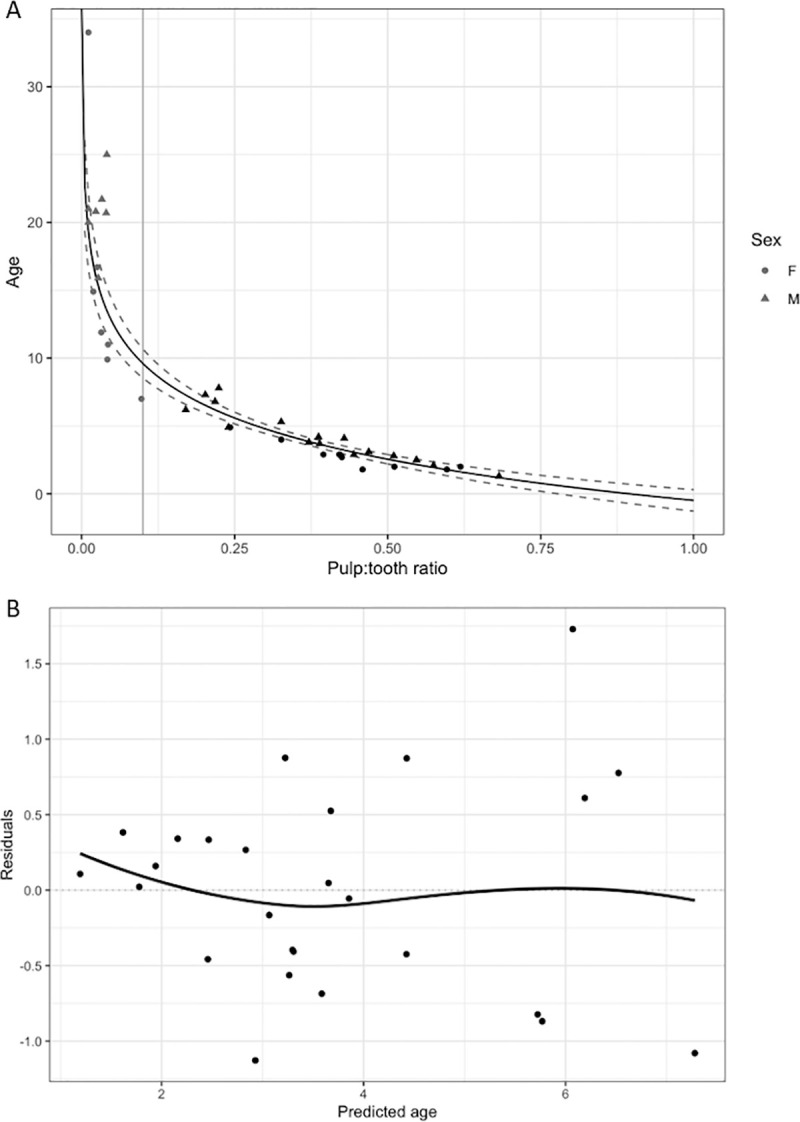
Fig 5. Fit and prediction error of the linear-log regression analysis.

(A) Plot of the training dataset used in the linear-log regression analysis to evaluate how well pulp:tooth area ratio can predict age. The points represent individual dolphins with both periapical dental radiographs and life history-based age estimates from SB and BB (n = 40). Due to the low number of samples for pulp:tooth area ratios between 0.04 and 0.17, as well as the wide range of life history-based ages for pulp:tooth area ratios less than 0.04, samples (grey points) with pulp:tooth area ratios < 0.1 (vertical grey line) were excluded. The remaining samples (black points, n = 26) were used to fit a linear-log model of pulp:tooth area ratio against predicted ages (black line, R2 = 0.85, confidence limits are given as dashed lines). Due to the low sample size, site or sex were not added as covariates, but there did not appear to be obvious differences between males (triangles) and females (circles), nor between the sites, above the 0.1 threshold. (B) Residual errors for the linear-log model including SB and BB dolphins (n = 26). The increasing variation in residuals with increasing age predictions indicates that the model performs better with larger pulp:tooth area ratios (younger animals).
