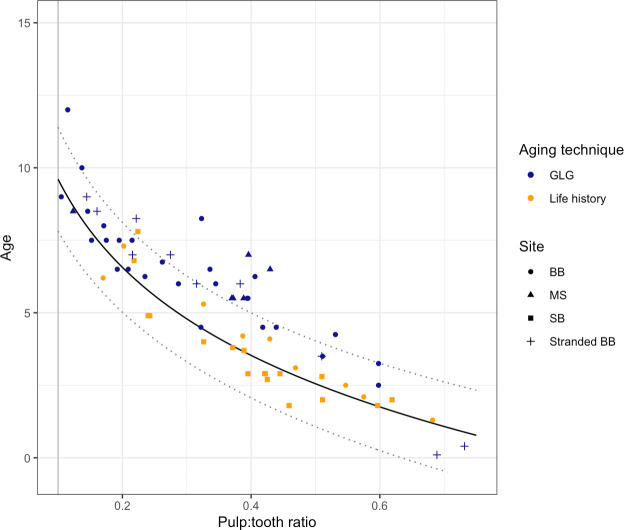
Fig 7. Plot of the linear-log model based on periapical dental radiographs compared to samples with tooth GLG and life history age estimates.
Orange points represent the training data set with life history-based age estimates; blue points represent samples without life history information, but with both tooth GLG-based age estimates and periapical dental radiographs. The data set includes both wild, living dolphins (from BB [circles], MS [triangles], and SB [squares]) and dead, stranded dolphins (crosses). The model (black solid line with prediction limits given as dotted lines) consistently predicts lower ages than the GLG-based age estimates (RMSPE = 1.65 years, compared to RMSE = 0.75 for the life history-based age estimates). Data are only shown for samples with a pulp:tooth area ratio ≥ 0.1 (vertical grey line).

