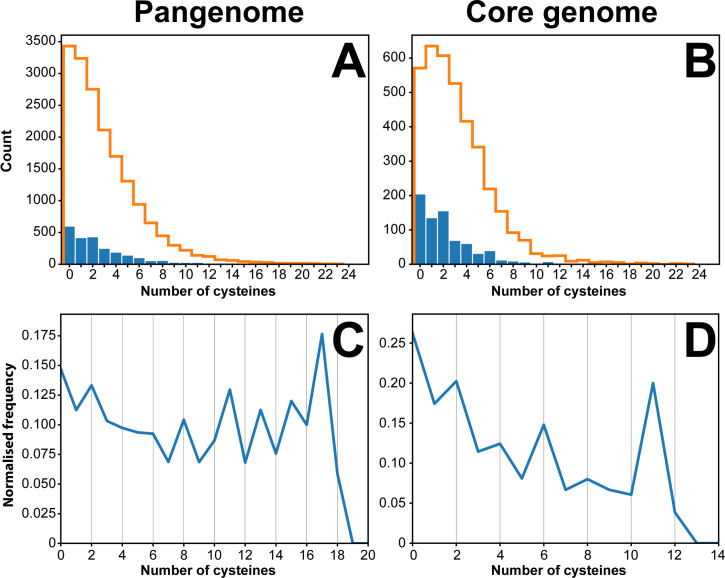
Fig 2. Cysteine distribution in the translated genome of B. pseudomallei.
Panel A shows the distribution of cysteines in the pangenome (19,991 proteins). Panel B represents the same analysis for the core genome, comprising 4,496 translated genes. Predicted number of extra-cytoplasmic proteins for each number of cysteines are represented as blue bars. Similarly, predicted cytoplasmic proteins are represented as orange lines. Panels C and D represent the normalised frequency of cysteine-containing extra-cytoplasmic proteins. The blue line in panel D peaks for proteins with 2, 4, 6 and 8 cysteines suggesting a preference for an even number of cysteines. This trend is not observed as strongly in panel C, where a clear peak can only be seen for two and eight cysteines. The normalised frequency was calculated by dividing the number of extra-cytoplasmic proteins (having N number of cysteines) by the total number of proteins with N cysteines (N being a number between 0–20 as per the data points in C and D above).

