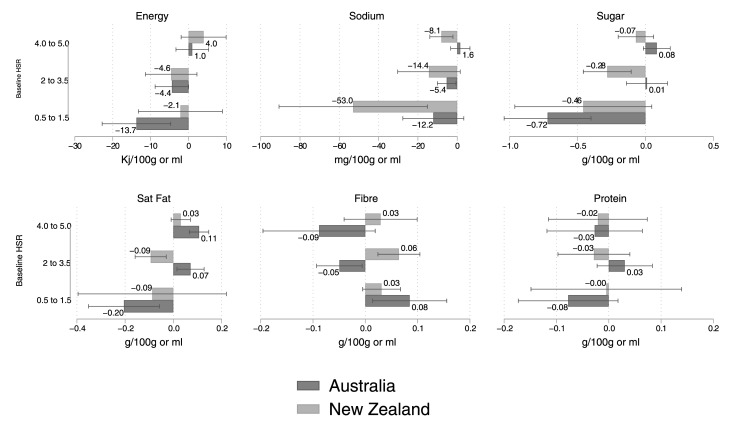
Fig 4. Stratified analyses on the 6 nutrient density outcomes by pretreatment HSR—4.0 to 5.0 (most nutritious), 2.0 to 3.5, and 0.5 to 1.5 (least nutritious).
Regression estimates and 95% CIs displayed. Data used to construct this figure are in S3 Text. CI, confidence interval; HSR, Health Star Rating.

