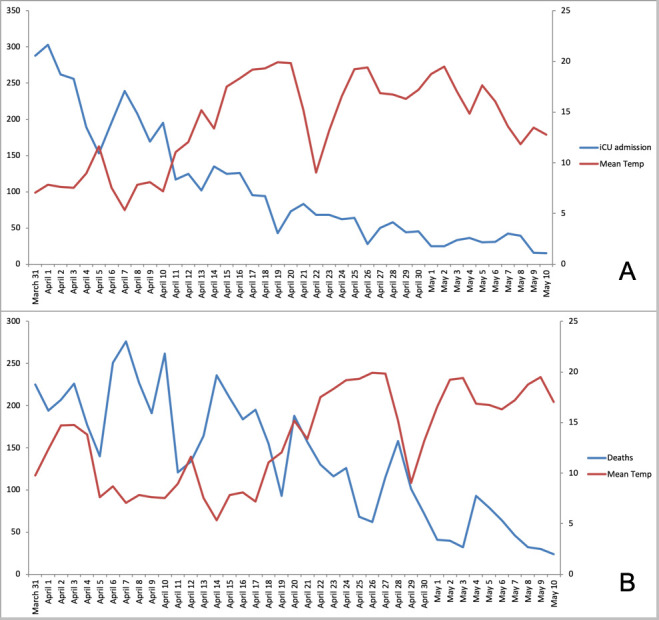
Fig 3.

Evolution of (A) ICU admissions and (B) daily death tolls (study period: 31 March to 10 May 2020) superimposed with mean environmental temperatures observed 8 days before ICU admission and 15 days before death (as these showed the highest correlation coefficients). Left ordinate is daily toll (0–350), right ordinate is temperature (0–25°C).
