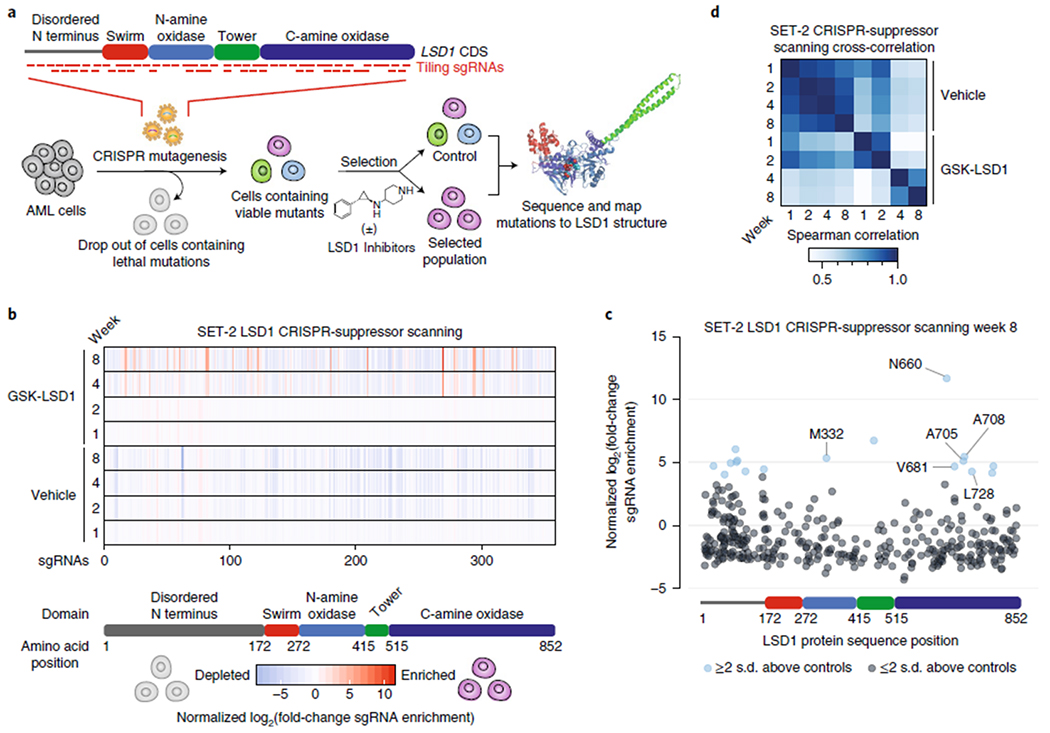
Fig. 1 |. CRISPR-suppressor scanning identifies regions of LSD1 that mediate its function and susceptibility to pharmacological inhibitors.

a, Schematic of CRISPR-suppressor scanning workflow to profile SARs of LSD1 small-molecule inhibitors. b, Heat maps depicting log2(fold-change sgRNA enrichment) in SET-2 at the indicated time points and conditions versus week 0 normalized against functionally neutral genome-targeting control sgRNAs. The sgRNAs are arrayed on the x axis by the LSD1 CDS. Color represents mean values across three replicate transductions. c, Scatter plot showing log2(fold-change sgRNA enrichment) in SET-2 under GSK-LSD1 treatment at week 8 versus week 0 normalized against functionally neutral genome-targeting control sgRNAs. The sgRNAs are arrayed on the x axis by the LSD1 CDS. Data represent mean values across three replicate transductions. d, Heat map showing cross-correlation of overall sgRNA enrichment at the specified time points during the CRISPR-suppressor scanning in SET-2. Data represent mean values across three replicate transductions.
