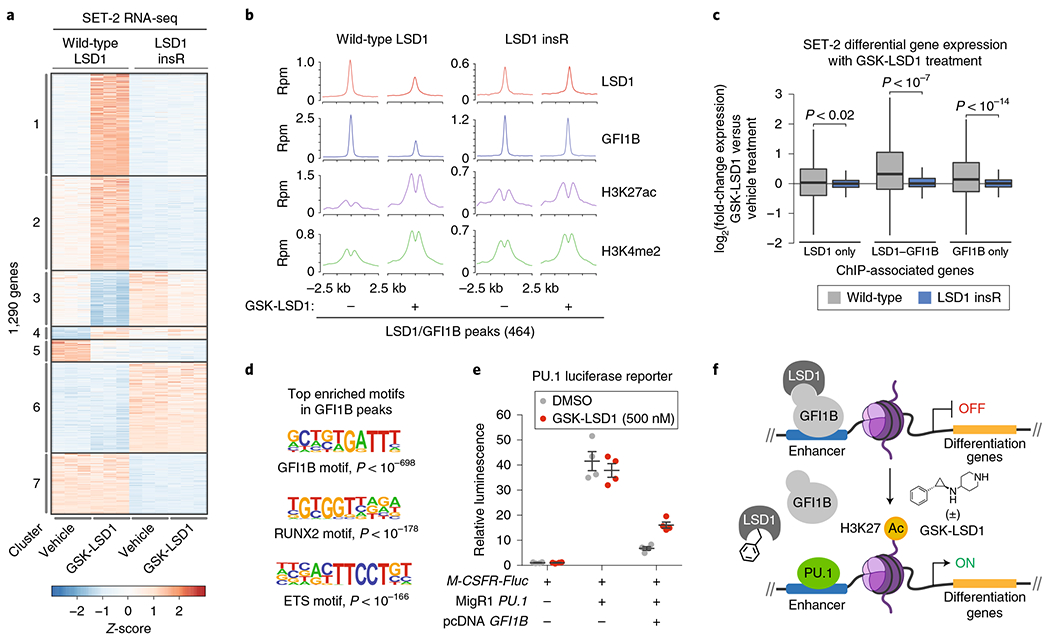
Fig. 6 |. Drug-resistant AML cells maintain LSD1-GFI1B binding on chromatin and fail to activate GFI1B-bound enhancers in the presence of GSK-LSD1.

a, Heat map showing expression profiles of the 1,290 most variably expressed genes (|log2(fold-change)|> 2, Padj<0.01) across wild-type SET-2 and SET-2 LSD1 insR after treatment with vehicle or GSK-LSD1 (250 nM, 48 h) for three replicates per condition, each shown independently. The adjusted P value for testing significance of differential expression was calculated using the Benjamini–Hochberg correction. Genes exhibiting correlated patterns of expression were grouped by k-means clustering (k = 7). Color represents Z-scores of gene expression across rows. b, ChIP-seq composite plots showing average signal (y axis, reads per million (r.p.m.)) for LSD1, GFI1B, H3K27ac and H3K4me2 in wild-type SET-2 and SET-2 LSD1 insR cells treated with vehicle or GSK-LSD1 (250 nM, 48 h) centered around LSD1-GFI1B co-occupied peaks identified in wild-type SET-2. The x axis shows flanking regions of ±2.5 kb around the peak center. Experiment performed once. c, Box plot showing differential gene expression of ChIP-seq-associated gene subsets upon GSK-LSD1 treatment (250 nM, 48 h) in wild-type SET-2 or SET-2 LSD1 insR cells. In the plot, bars represent the median, the box represents the IQR and the whiskers represent 1.5× IQR. P values were calculated using the Wilcoxon test (two-sided). d, Consensus GFI1B, RUNX2 and ETS motif logos detected in GFI1B ChIP-seq peaks in wild-type SET-2 cells. The corresponding P values for enrichment are calculated as previously described38. e, Scatter plots showing relative firefly luciferase (Fluc) expression in the absence or presence of a PU.1 reporter plasmid (M-CSFR-Fluc), PU.1 expression plasmid (MigR1 PU.1), GFI1B expression plasmid (pcDNA GFI1B), or GSK-LSD1 (500 nM, 48 h). Gray lines represent mean±s.e.m. across four replicates. One of two independent replicates is shown. f, Schematic of a proposed model, whereby GSK-LSD1 induces displacement of a LSD1-GFI1B complex from enhancers allows PU.1-mediated activation of genes involved in AML differentiation.
