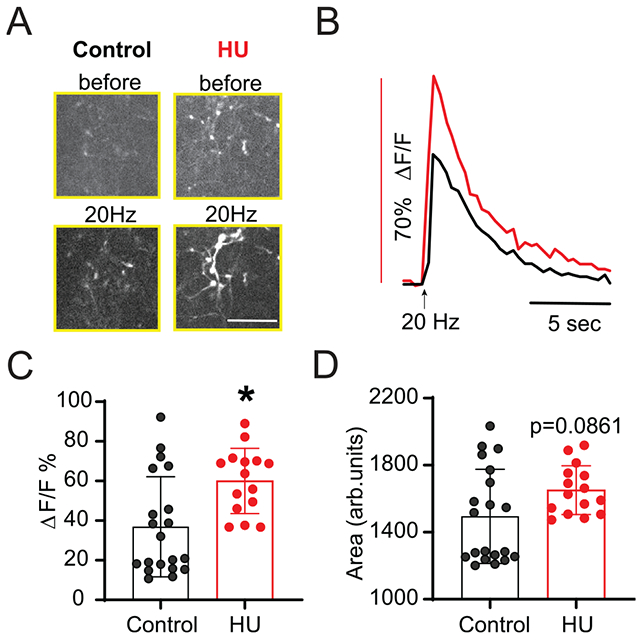
Fig. 3.

HU increases TS-afferent calcium entry. (A) Live-cell calcium imaging demonstrating individual afferent (GCaMP6m pre-labeled) before and during TS stimulation at 20 Hz (scale bar: 30 μm). Calcium influx following TS stimuli is greater in HU compared to control. (B) Example traces of Ca2+ fluorescence from a control (black) and HU (red) afferent during TS stimuli showing that the magnitude of fluorescence response is increased in HU. (C) Average changes in fluorescence reported as percent change from pre-stimulation base-line (ΔF/F%). (D) Quantitative data of fluorescence area showing the near significant increase in HU compared to control. Data are shown as mean±SD. *p<0.05 HU vs control, Mann–Whitney test (C, D).
