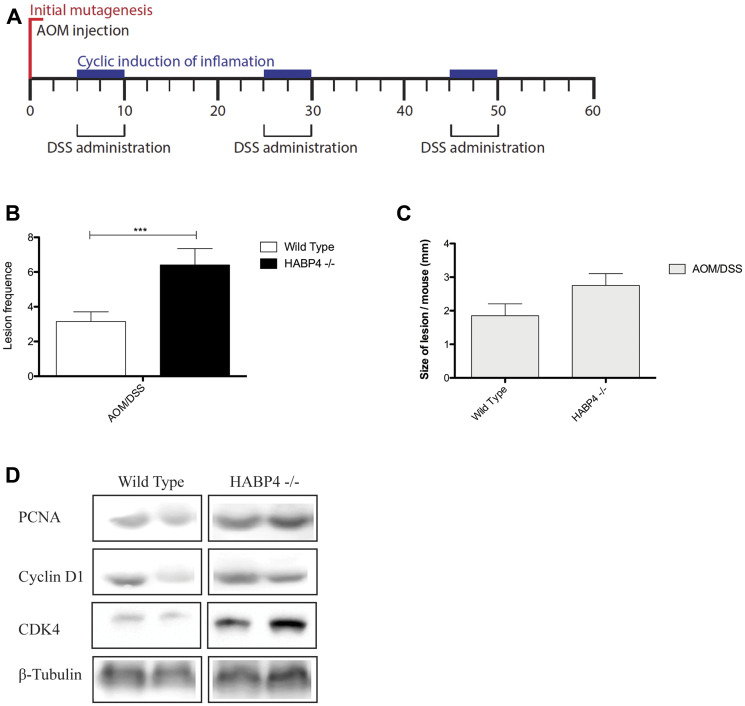
Figure 5. Colon tumor induction in control and knockout mice.
(A) Representative scheme of tumor colon induced by AOM and DSS treatment (WT control n = 12; WT AOM/DSS n = 26; HABP4 –/– control n = 11; HABP4 –/– AOM/DSS n = 22); Quantification of the (B) number and (C) size of tumors between Habp4 –/– and wild-type mice after tumor induction treatment; (D) Western blot analysis of proteins involved in cell proliferation. Error bars are SD. *** p < 0.0001.

