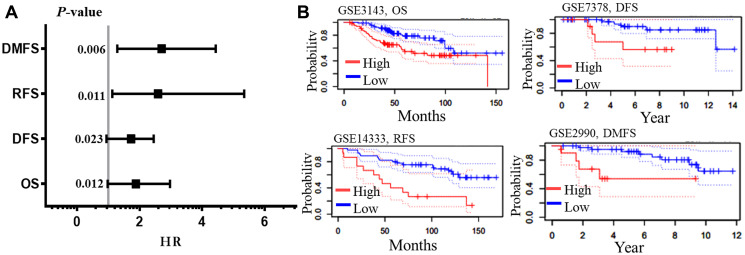
Figure 4. Survival analysis of AURKA in BC.
The meta-analysis of the hazard ration with their p-values (A), and the four end points pictorial images from PrognoScan database. (B) The survival curves depict the high (Red) and low (blue) expressions with the datasets and endpoints. Abbreviations: OS: overall survival; DFS: disease free survival; RFS: relapses free survival; DMFS: distance metastasis free survival; HR: hazard ratio.

